
Sales volume increases, median sales price up 4.1% from April
Sales Volume
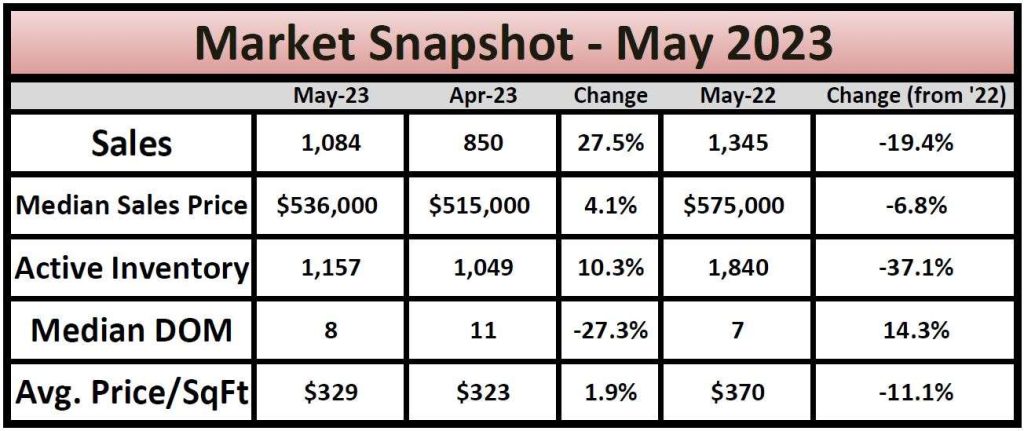
- May closed with 1,084 sales – a 27.5% increase over April (850 sales)
- 19.4% less sales than May 2022 (1,345 sales)
- Conventional Financing accounts for 66% of sales this month, Cash and FHA at 13.6% and 14%, respectively
Sales Price
- Median sales price increased 4.1% from $515,000 to $536,000
- 6.8% decrease from May 2022 ($575,000)
- The median sales price shows that exactly half of the monthly sales are above this price and exactly half of the sales are below this price
Listing Inventory
- Listing Inventory increased 10.3% from April to May, from 1,049 units to 1,157 units
- Compared with May 2022 (1,345), inventory is down 19.4%
- The Months of Inventory decreased from 1.2 Months to 1.1 Months
- Months of Inventory represents the amount of time (in months) it would take for the current rate of sales to deplete the total active listing inventory
Days on Market
- Median DOM (days on market) decreased from 11 to 8, up from 7 DOM in May 2022
- Of the 1,084 sales this month, 81.4% (882) were on the market for 30 days or less and 91.2% (988) were on the market for 60 days or less
Summary
More homes selling, spending even less time on market. Prices see increase for second month, indicating sustained competition. Most homes sold were in the $500k – $549k range (170 units).
