

Sales volume dips for year’s start, sales price sees increase
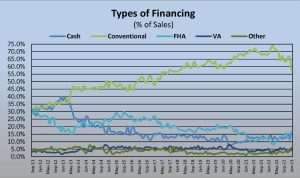
January closed with 572 sales, a 28.9% decrease from December (804). Compared to one year ago (1,030), the current figure is down 44.5%. Of the 572 sales this month, 92 (16.1%) used cash financing, 329 (57.5%) used conventional, 95 (16.6%) used FHA, 33 (5.8%) used VA and 23 (4%) used Other† types of financing. The chart below shows percentage of sales by types of financing since September 2011.
The median sales price increased 2.9% from $485,000 to $499,000. This figure is a 4.4% decrease from January 2022. The median sales price shows that exactly half of the monthly sales are above this price and exactly half of the sales are below this price.
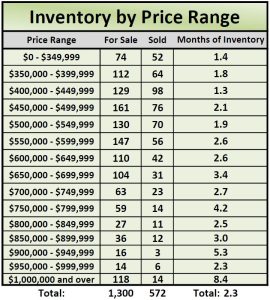
The Active Listing Inventory decreased 11.4% from December to January, from 1,468 units to 1,300 units. Compared with January 2022 (792), inventory is up 64.1%. The Months of Inventory increased from 1.8 Months to 2.3 Months. This figure represents the amount of time (in months) it would take for the current rate of sales to deplete the total active listing inventory.
The Median DOM (days on market) increased from 26 to 29 and the Average DOM increased from 40 to 44. “Days on market” represents the days between the initial listing of the home as “active” and the day it goes “pending.” Of the 572 sales this month, 51.6% (295) were on the market for 30 days or less and 73.1% (418) were on the market for 60 days or less.
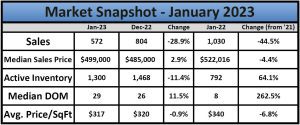
The Average Price/SqFt of all homes sold decreased from $320 to $317. Compared to one year ago ($340), this is a 6.7% decrease. See all statistical reports compiled by the Sacramento Association of REALTORS®.
Tony Vicari, Director of Communications
tvicari@sacrealtor.org
916-437-1205
