Housing Statistics - March 25
The number of for sale listings was up 42.8% from one year earlier and up 8.9% from the previous month. The number of sold listings decreased 4% year over year and increased 15.6% month over month. The number of under contract listings was up 33.1% compared to previous month and up 9.1% compared to previous year.
- The Months of Inventory based on Closed Sales was 2, up 52.6% from the previous year.
- The Average Sold Price per Square Footage was down 0.6% compared to previous month and down 1.2% compared to last year.
- The Median Sold Price increased by 1.8% from last month.
- The Average Sold Price also increased by 4.5% from last month.
- Based on the 6 month trend, the Average Sold Price trend was “Appreciating” and the Median Sold Price trend was “Appreciating”.
- The Average Days on Market showed a neutral trend, an increase of 18.5% compared to previous year. The ratio of Sold Price vs. Original List Price was 99%, a decrease of 1% compared to previous year.
| Category | Mar. 2025 vs. Feb. 2025 | % Change | Mar. 2025 vs. Mar. 2024 | % Change | Jan. 2025 to Mar. 2025 vs. Jan. 2024 to Mar. 2024 | % Change |
|---|---|---|---|---|---|---|
| For Sale | 1,631 vs. 1,498 | 8.9% up | 1,631 vs. 1,142 | 42.8% up | 1,631 vs. 1,142 | 42.8% up |
| Sold | 824 vs. 713 | 15.6% up | 824 vs. 858 | -4% down | 2,254 vs. 2,269 | -0.7% down |
| Pended | 1,058 vs. 795 | 33.1% up | 1,058 vs. 970 | 9.1% up | 2,612 vs. 2,549 | 2.5% up |
| Avg. Sq. Ft. Price (Sold) | 337 vs. 339 | -0.6% down | 337 vs. 341 | -1.2% down | 338 vs. 333 | 1.5% up |
| Avg. Days on Market | 32 vs. 37 | -13.5% down | 32 vs. 27 | 18.5% up | 36 vs. 32 | 12.5% up |
| Sold/Orig LP Diff. % | 99 vs. 98 | 1% up | 99 vs. 100 | -1% down | 98 vs. 99 | -1% down |
| Avg. Active Price | 696 vs. 678 | 2.7% up | 696 vs. 757 | -8.1% down | 688 vs. 760 | -9.5% down |
| Avg. Sold Price | 621 vs. 594 | 4.5% up | 621 vs. 598 | 3.8% up | 606 vs. 590 | 2.7% up |
| Months of Inventory (Closed Sales) | 2 vs. 2.1 | -4.8% down | 2 vs. 1.3 | 52.6% up | 2.2 vs. 1.5 | 46.4% up |
| Residential | 2 Bedrooms | 3 Bedrooms | 4 Bedrooms | 5+ Bedrooms | All Bedrooms |
|---|---|---|---|---|---|
| Closed | #Units: 145 Dollar Value: $59,272,567 Average List Price: $412,236 Average Close Price: $408,776 Average Market Time: 35 Average Square Feet: 1152 % of List Price: 99.16% | #Units: 443 Dollar Value: $238,721,151 Average List Price: $536,919 Average Close Price: $538,874 Average Market Time: 30 Average Square Feet: 1548 % of List Price: 100.36% | #Units: 283 Dollar Value: $199,217,979 Average List Price: $705,648 Average Close Price: $703,950 Average Market Time: 32 Average Square Feet: 2170 % of List Price: 99.76% | #Units: 56 Dollar Value: $54,591,638 Average List Price: $986,115 Average Close Price: $974,851 Average Market Time: 50 Average Square Feet: 3266 % of List Price: 98.86% | #Units: 927 Dollar Value: $551,803,335 Average List Price: $596,063 Average Close Price: $595,257 Average Market Time: 33 Average Square Feet: 1780 % of List Price: 99.86% |
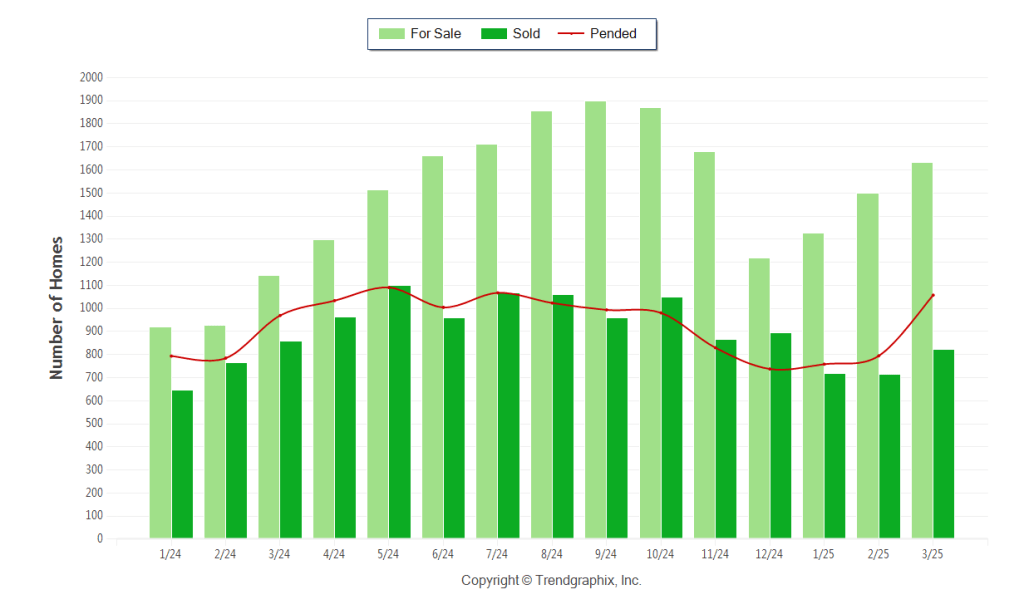
Property Sales (Sold)
March property sales were 824, down 4% from 858 in March of 2024 and 15.6% higher than the 713 sales last month.
Current Inventory (For Sale)
Versus last year, the total number of properties available this month was higher by 489 units of 42.8%. This year’s bigger inventory means that buyers who waited to buy may have bigger selection to choose from. The number of current inventory was up 8.9% compared to the previous month.
Property Under Contract (Pended)
There was an increase of 33.1% in the pended properties in March, with 1,058 properties versus 795 last month. This month’s pended property sales were 9.1% higher than at this time last year.
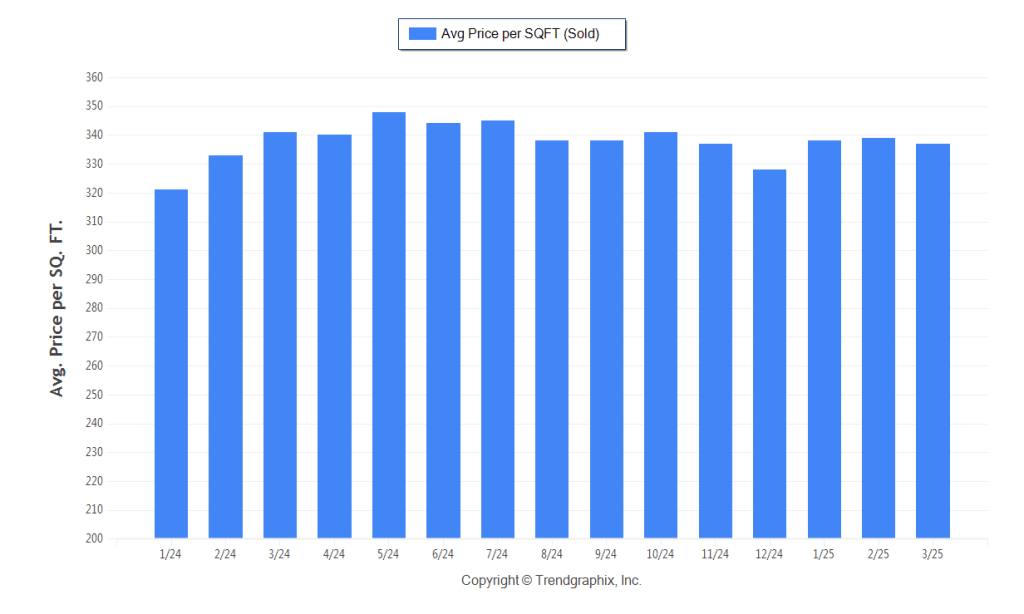
The Average Sold Price per Square Footage was Neutral*
The Average Sold Price per Square Footage is a great indicator for the direction of property values. Since Median Sold Price and Average Sold Price can be impacted by the ‘mix’ of high or low end properties in the market, the Average Sold Price per Square Footage is a more normalized indicator on the direction of property values.
The March 2025 Average Sold Price per Square Footage of $337 was down 0.6% from $339 last month and down 1.2% from $341 in March of last year.
* Based on 6 month trend – Appreciating/Depreciating/Neutral
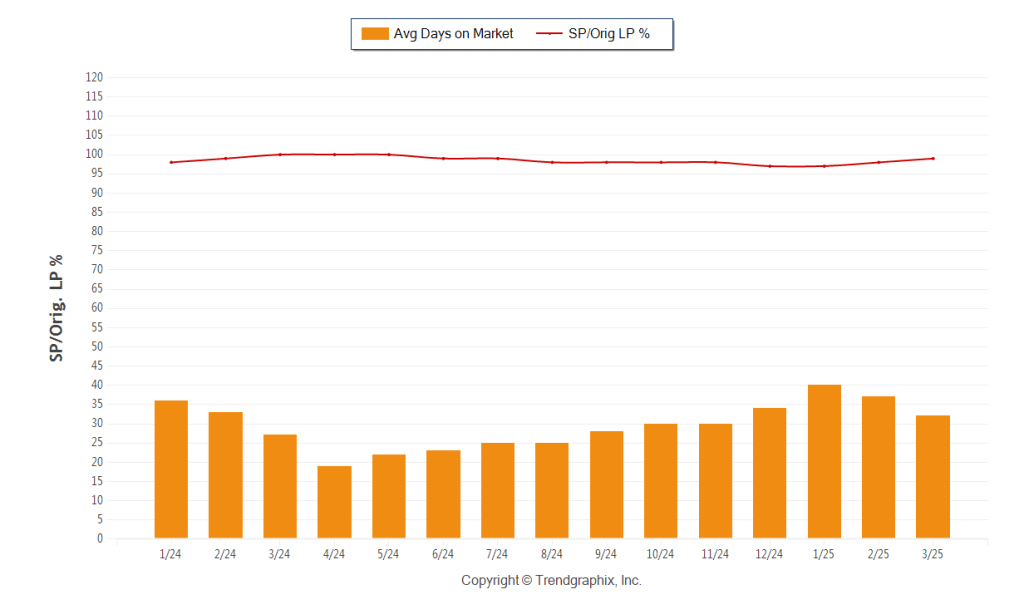
The Days on Market Showed Neutral Trend*
The average Days on Market (DOM) shows how many days the average property is on the market before it sells. An upward trend in DOM trends to indicate a move towards more of a Buyer’s market, a downward trend indicates a move towards more of a Seller’s market. The DOM for March 2025 was 32, down 13.5% from 37 days last month and up 18.5% from 27 days in March of last year.
The Sold/Original List Price Ratio Remains Steady**
The Sold Price vs. Original List Price reveals the average amount that sellers are agreeing to come down from their original list price. The lower the ratio is below 100% the more of a Buyer’s market exists, a ratio at or above 100% indicates more of a Seller’s market. This month Sold Price vs. Original
List Price of 99% was up 1% % from last month and down from 1% % in March of last year.
* Based on 6 month trend – Upward/Downward/Neutral
** Based on 6 month trend – Rising/Falling/Remains Steady
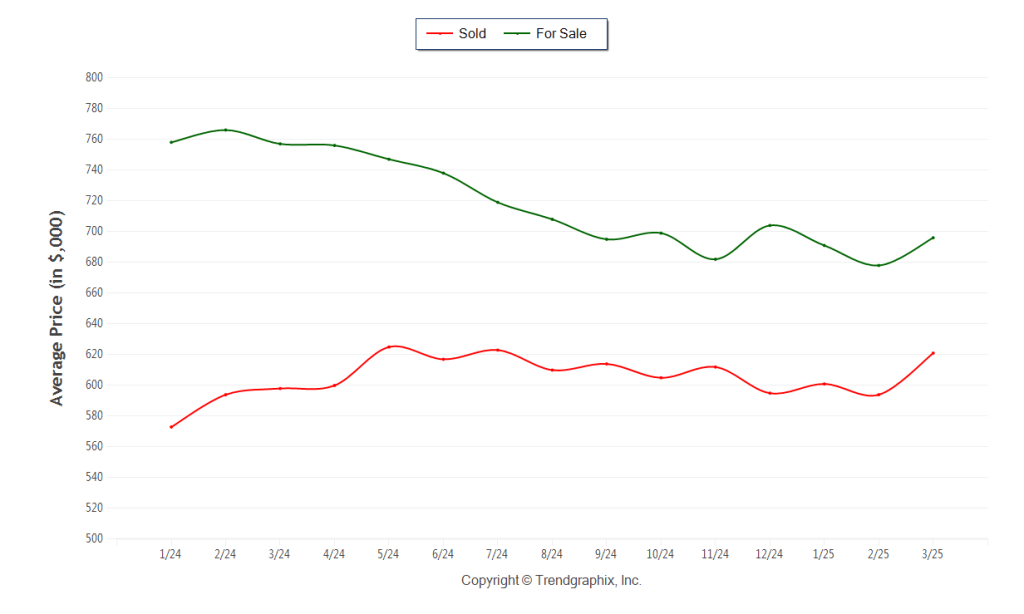
The Average For Sale Price was Neutral*
The Average For Sale Price in March was $696,000, down 8.1% from $757,000 in March of 2024 and up 2.7% from $678,000 last month.
The Average Sold Price was Appreciating*
The Average Sold Price in March was $621,000, up 3.8% from $598,000 in March of 2024 and up 4.5% from $594,000 last month.
The Median Sold Price was Appreciating*
The Median Sold Price in March was $560,000, up 1.3% from $553,000 in March of 2024 and up 1.8% from $550,000 last month.
* Based on 6 month trend – Appreciating/Depreciating/Neutral
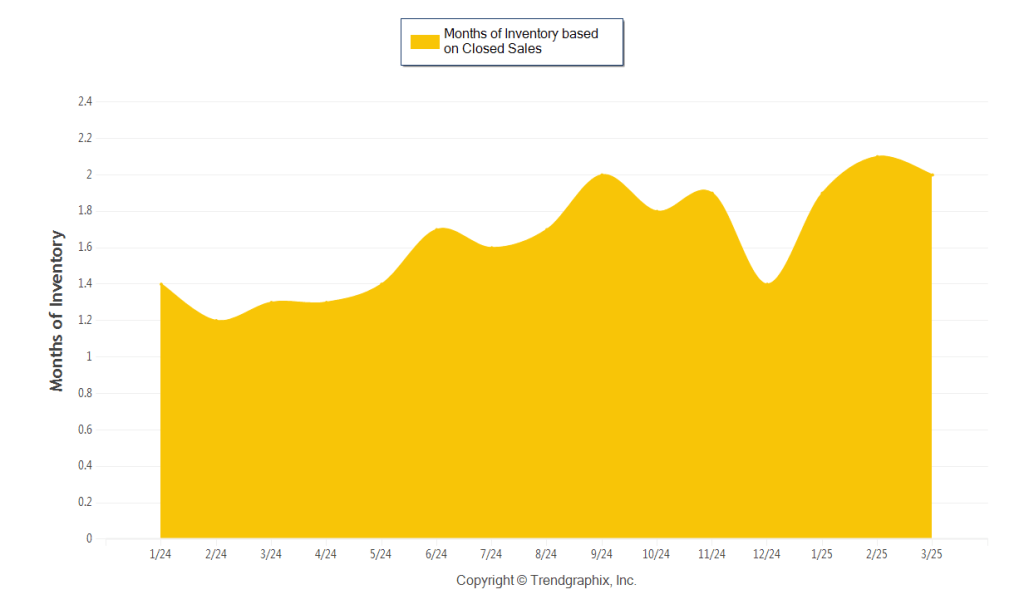
A comparatively lower Months of Inventory is more beneficial for sellers while a higher months of inventory is better for buyers.
*Buyer’s market: more than 6 months of inventory
Seller’s market: less than 3 months of inventory
Neutral market: 3 – 6 months of inventory
Months of Inventory based on Closed Sales
The March 2025 Months of Inventory based on Closed Sales of 2 was increased by 52.6% compared to last year and down 4.8% compared to last month. March 2025 was Seller’s market.
Months of Inventory based on Pended Sales
The March 2025 Months of Inventory based on Pended Sales of 1.5 was increased by 25.5% compared to last year and down 21.2% compared to last month. March 2025 was Seller’s market.