Housing Statistics - February 2025
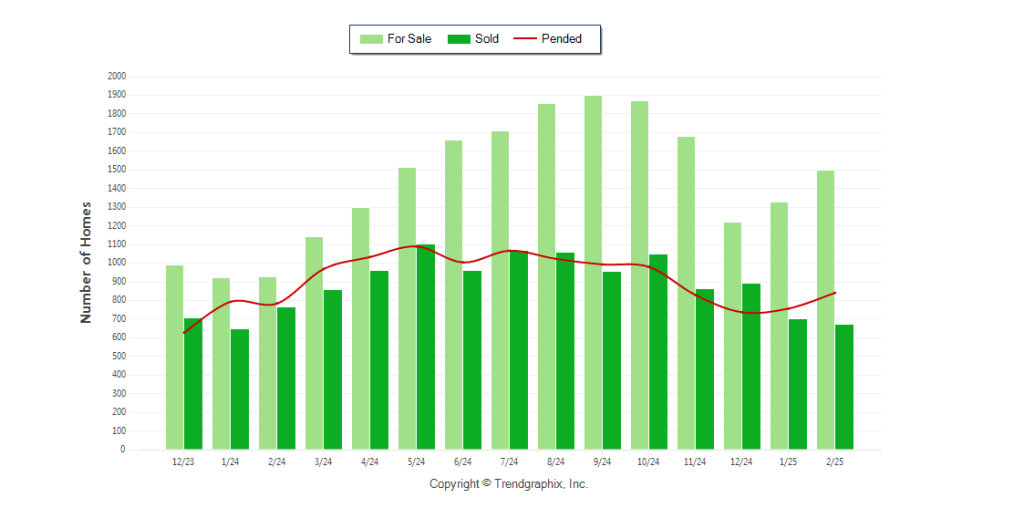
For-sale listings increased 61.6% year-over-year and 12.9% from last month, giving buyers more options. Sold listings declined 12% from last year and 4.5% from last month, while pending sales rose 7.3% year-over-year and 11.1% month-over-month, suggesting future sales growth.
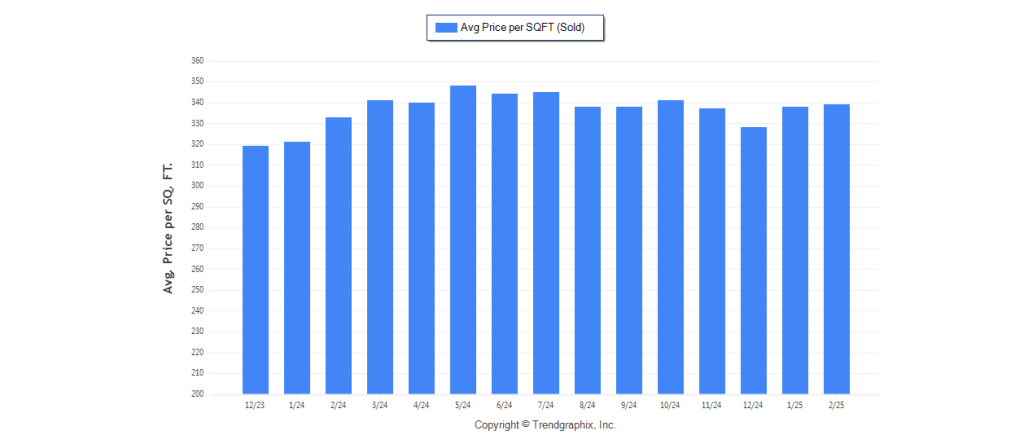
Months of inventory increased to 2.2 months, up 82.4% from last year, signaling a shift toward a more balanced market. The average sold price per square foot was $339, up 0.3% month-over-month and 1.8% year-over-year, showing steady home values. Meanwhile, the average sold price declined 1.3% from last month, indicating a neutral pricing trend.
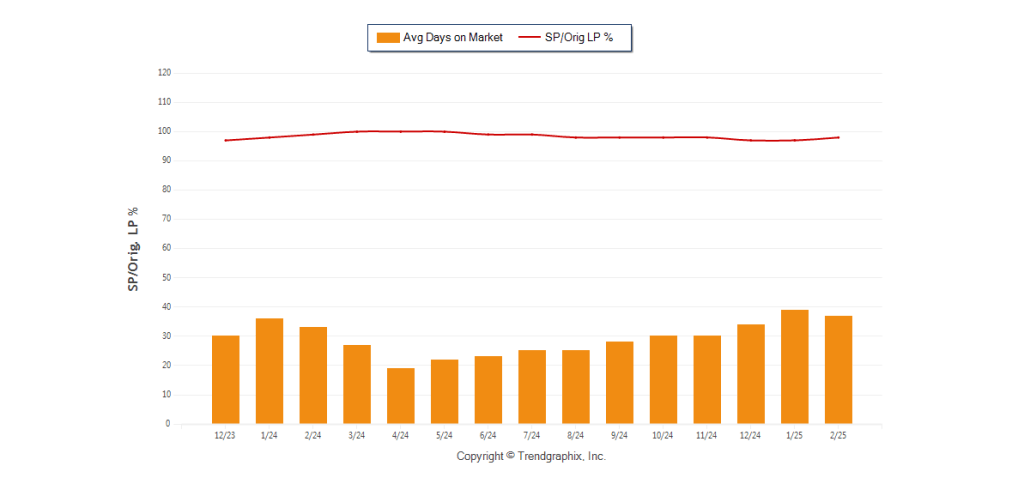
Homes spent an average of 37 days on the market, slightly faster than last month but 12.1% longer than last year. Sellers received 98% of their original list price, down 1% from last year, reflecting minor price adjustments.
| Category | Feb. 2025 vs. Jan. 2025 | % Change | Feb. 2025 vs. Feb. 2024 | % Change | Dec. 2024 to Feb. 2025 vs. Previous Year | % Change |
|---|---|---|---|---|---|---|
| For Sale | 1,498 vs. 1,327 | 12.9% up | 1,498 vs. 927 | 61.6% up | 1,498 vs. 927 | 61.6% up |
| Sold | 672 vs. 704 | -4.5% down | 672 vs. 764 | 12% down | 2,271 vs. 2,120 | 7.1% up |
| Pended | 842 vs. 758 | 11.1% up | 842 vs. 785 | 7.3% up | 2,338 vs. 2,208 | 5.9% up |
| Avg. Sq. Ft. Price (Sold) | 339 vs. 338 | 0.3% up | 339 vs. 333 | 1.8% up | 334 vs. 325 | 2.8% up |
| Avg. Days on Market | 37 vs. 39 | 5.1% down | 37 vs. 33 | 12.1% up | 36 vs. 31 | 9.1% up |
| Sold/Orig LP Diff. % | 98 vs. 97 | 1% up | 98 vs. 99 | -1% down | 97 vs. 98 | -1% down |
| Avg. Active Price | 678 vs. 691 | -1.9% down | 978 vs. 766 | -11.5% down | 690 vs. 750 | -8% down |
| Avg. Sold Price | 592 vs. 600 | 1.3% down | 592 vs. 594 | 0.3% down | 596 vs. 578 | 3.1% up |
| Months of Inventory (Closed Sales) | 2.2 vs. 1.9 | 15.9% up | 2.2 vs. 1.2 | 82.4% up | 2 vs. 1.3 | 53.4% up |
| Residential | 2 Bedrooms | 3 Bedrooms | 4 Bedrooms | 5+ Bedrooms | All Bedrooms |
|---|---|---|---|---|---|
| Closed |
#Units: 144 Dollar Value: $61,248,012 Average List Price: $428,445 Average Close Price: $425,333 Average Market Time: 47 Average Square Feet: 1146 % of List Price: 99.27% |
#Units: 409 Dollar Value: $217,672,763 Average List Price: $534,232 Average Close Price: $532,207 Average Market Time: 35 Average Square Feet: 1506 % of List Price: 99.62% |
#Units: 212 Dollar Value: $138,143,539 Average List Price: $655,705 Average Close Price: $651,620 Average Market Time: 40 Average Square Feet: 2109 % of List Price: 99.38% |
#Units: 45 Dollar Value: $39,554,974 Average List Price: $891,259 Average Close Price: $878,999 Average Market Time: 47 Average Square Feet: 2979 % of List Price: 98.62% |
#Units: 810 Dollar Value: $456,619,288 Average List Price: $567,054 Average Close Price: $563,728 Average Market Time: 39 Average Square Feet: 1682 % of List Price: 99.41% |
Property Sales (Sold)
February property sales were 672, down 12% from 764 in February 2024 and 4.5% lower than the 704 sales last month. The decline in closed sales suggests a potential cooling in buyer activity, though pending sales indicate future closings may increase.
Current Inventory (For Sale)
Compared to last year, the total number of available properties increased by 61.6%, with 1,498 homes on the market versus 927 in February 2024. This means buyers have significantly more options compared to last year. Inventory also saw a 12.9% increase from last month, continuing the trend of growing housing supply.
Property Under Contract (Pended)
Pending sales increased by 11.1% month-over-month, with 842 properties under contract compared to 758 in January. Compared to last year, pending sales rose 7.3%, suggesting that while closed sales have slowed, more transactions are in the pipeline, potentially leading to higher sales in the coming months.
The Average Sold Price per Square Footage was Neutral*
The Average Sold Price per Square Foot is a strong indicator of property value trends. Unlike the median or average sold price, which can be influenced by the mix of high-end or low-end properties, the price per square foot provides a more normalized measure of market direction.
In February 2025, the Average Sold Price per Square Foot was $339, showing a 0.3% increase from $338 last month and a 1.8% increase from $333 in February 2024. While price appreciation has slowed compared to last year, the modest upward trend suggests property values are holding steady in Sacramento County.
* Based on 6 month trend – Appreciating/Depreciating/Neutral
The Days on Market Showed a Neutral Trend*
The Average Days on Market (DOM) indicates how long properties are staying on the market before selling. An increase in DOM typically signals a shift toward a buyer’s market, while a decrease suggests stronger seller conditions.
In February 2025, the average DOM was 37 days, down 5.1% from 39 days last month, but up 12.1% from 33 days in February 2024. This suggests that while homes are selling slightly faster compared to last month, they are taking longer to sell compared to last year—indicating a gradual shift in market conditions.
The Sold/Original List Price Ratio Remains Steady**
The Sold Price vs. Original List Price Ratio reveals how much sellers are adjusting their asking prices. A lower ratio (below 100%) suggests buyers have more negotiating power, while a higher ratio (near or above 100%) favors sellers.
In February 2025, the Sold/Original List Price Ratio was 98%, up 1% from 97% last month, but down 1% from 99% in February 2024. This suggests that sellers are still receiving close to their asking price, but slight downward pressure may be emerging compared to last year.
* Based on 6 month trend – Upward/Downward/Neutral
** Based on 6 month trend – Rising/Falling/Remains Steady
The Average For Sale Price was Depreciating*
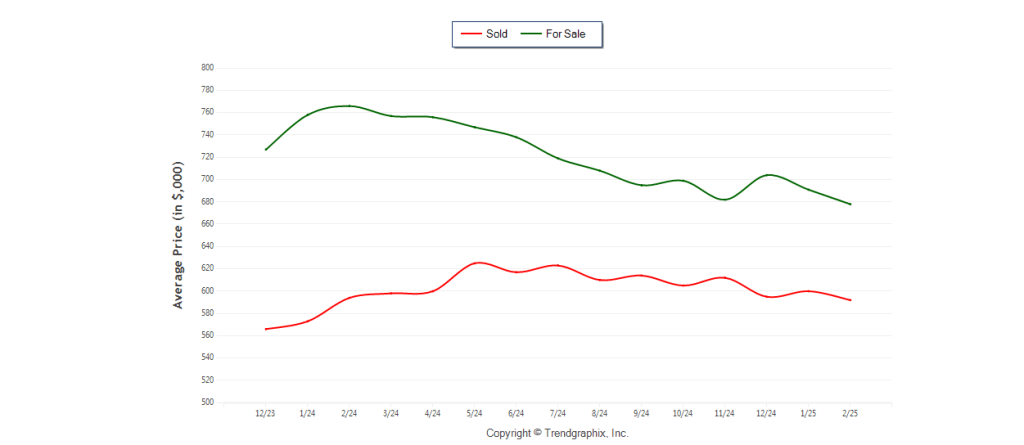
The Average For Sale Price in February 2025 was $678,000, reflecting a 1.9% decrease from $691,000 last month and an 11.5% decline from $766,000 in February 2024. This downward trend suggests that sellers are adjusting their listing prices in response to shifting market conditions and increased inventory.
The Average Sold Price Was Depreciating*
The Average Sold Price in February 2025 was $592,000, down 1.3% from $600,000 last month, but only slightly down by 0.3% from $594,000 in February 2024. This suggests that while list prices are decreasing, actual sale prices remain relatively stable, indicating sustained buyer demand within current market conditions.
The Median Sold Price was Neutral*
The Median Sold Price in February was $550,000, up 1.9% from $540,000 in February of 2024 and up 1.9% from $540,000 last month
* Based on 6 month trend – Appreciating/Depreciating/Neutral
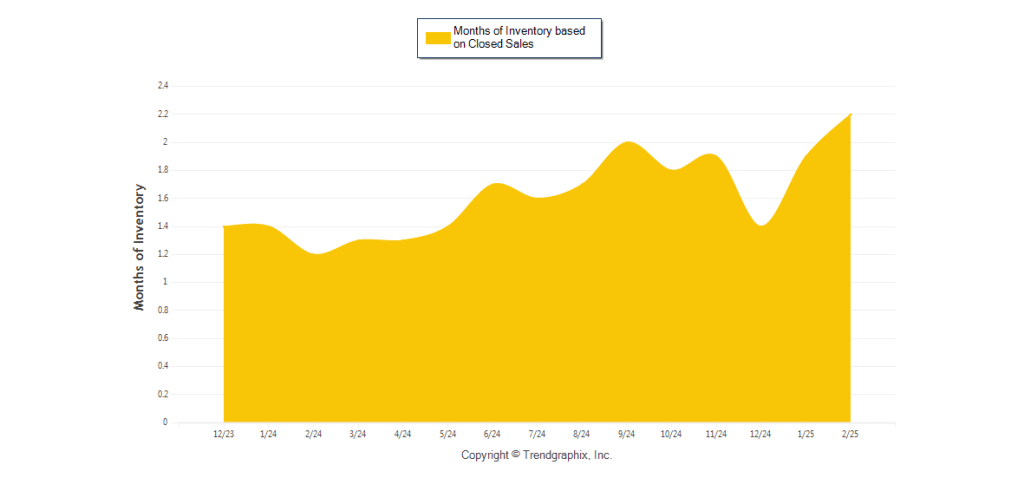
Months of Inventory Indicates a Shift Toward a More Balanced Market
A lower Months of Inventory favors sellers, while a higher Months of Inventory benefits buyers.
- Buyer’s Market: More than 6 months of inventory
- Seller’s Market: Less than 3 months of inventory
- Neutral Market: 3–6 months of inventory
Months of Inventory Based on Closed Sales
The February 2025 Months of Inventory based on Closed Sales was 2.2 months, reflecting a 15.9% increase from 1.9 months last month and a significant 82.4% increase from 1.2 months in February 2024. While this still classifies as a seller’s market, the increase suggests a shift toward a more balanced market, providing buyers with more options.
Months of Inventory based on Pended Sales
The February 2025 Months of Inventory based on Pended Sales of 1.8 was increased by 50.8% compared to last year and the same compared to last month. February 2025 was Seller’s market.