Housing Statistics - January 25
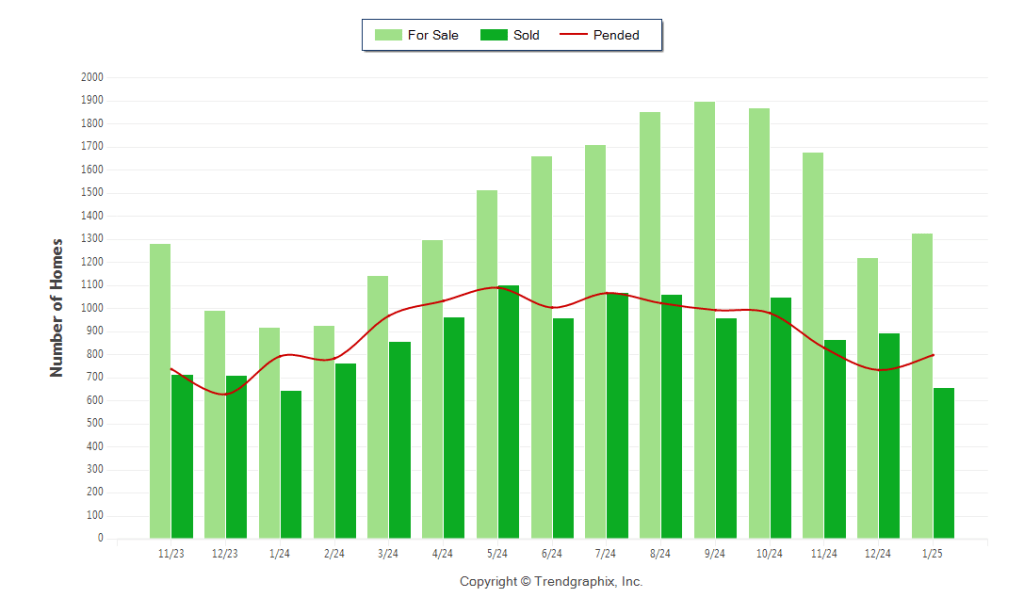
The number of for sale listings was up 44.2% from one year earlier and up 8.8% from the previous month. The number of sold listings increased 1.9% year over year and decreased 26.5% month over month. The number of under contract listings was up 8.9% compared to previous month and up 0.6% compared to previous year.
- The Months of Inventory based on Closed Sales was 2, up 42.2% from the previous year.
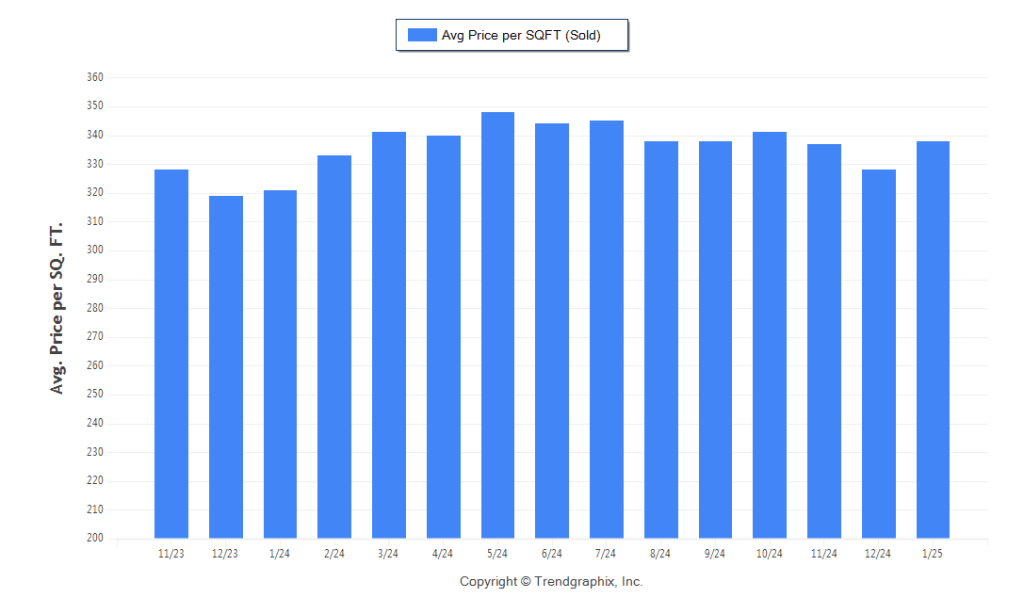
- The Average Sold Price per Square Footage was up 3% compared to previous month and up 5.3% compared to last year.
- The Median Sold Price decreased by 1.6% from last month. The Average Sold Price also increased by 0.7% from last month. Based on the 6 month trend, the Average Sold Price trend was “Neutral” and the Median Sold Price trend was “Depreciating”.
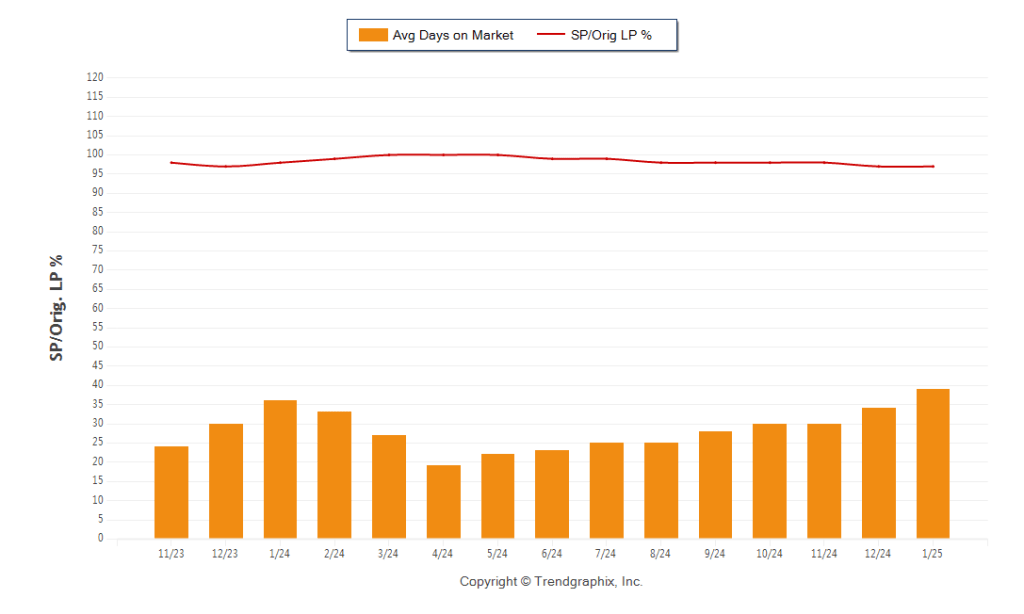
- The Average Days on Market showed a upward trend, an increase of 8.3% compared to previous year. The ratio of Sold Price vs. Original List Price was 97%, a decrease of 1% compared to previous year.
| Category | Jan. 2025 vs. Dec. 2024 | % Change | Jan. 2025 vs. Jan. 2024 | % Change | Nov. 2024 to Jan. 2025 vs. Previous Year | % Change |
|---|---|---|---|---|---|---|
| For Sale | 1,327 vs. 1,220 | 8.8% up | 1,327 vs. 920 | 44.2% up | 1,327 vs. 920 | 44.2% up |
| Sold | 659 vs. 896 | -26.5% down | 659 vs. 647 | 1.9% up | 2,420 vs. 2,072 | 16.8% up |
| Pended | 799 vs. 734 | 8.9% up | 799 vs. 794 | 0.6% up | 2,363 vs. 2,161 | 9.3% up |
| Avg. Sq. Ft. Price (Sold) | 338 vs. 328 | 3% up | 338 vs. 321 | 5.3% up | 334 vs. 323 | 3.4% up |
| Avg. Days on Market | 39 vs. 34 | 14.7% up | 39 vs. 36 | 8.3% up | 34 vs. 30 | 13.3% up |
| Sold/Orig LP Diff. % | 97 vs. 97 | 0% | 97 vs. 98 | -1% down | 97 vs. 98 | -1% down |
| Avg. Active Price | 691 vs. 704 | -1.8% down | 691 vs. 758 | -8.8% down | 691 vs. 733 | -5.7% down |
| Avg. Sold Price | 600 vs. 596 | 0.7% up | 600 vs. 573 | 4.7% up | 603 vs. 568 | 6.2% up |
| Months of Inventory (Closed Sales) | 2 vs. 1.4 | 44.1% up | 2 vs. 1.4 | 42.2% up | 1.6 vs. 1.3 | 22.5% up |
| Residential | 2 Bedrooms | 3 Bedrooms | 4 Bedrooms | 5+ Bedrooms | All Bedrooms |
|---|---|---|---|---|---|
| Closed |
#Units: 125 Dollar Value: $49,909,578 Average List Price: $404,204 Average Close Price: $399,277 Average Market Time: 51 Average Square Feet: 1137 % of List Price: 98.78% |
#Units: 371 Dollar Value: $192,770,499 Average List Price: $521,872 Average Close Price: $519,597 Average Market Time: 36 Average Square Feet: 1483 % of List Price: 99.56% |
#Units: 226 Dollar Value: $153,911,470 Average List Price: $688,936 Average Close Price: $681,024 Average Market Time: 42 Average Square Feet: 2124 % of List Price: 98.85% |
#Units: 49 Dollar Value: $48,285,319 Average List Price: $1,008,151 Average Close Price: $985,415 Average Market Time: 47 Average Square Feet: 3145 % of List Price: 97.74% |
#Units: 771 Dollar Value: $444,876,866 Average List Price: $582,671 Average Close Price: $577,013 Average Market Time: 41 Average Square Feet: 1721 % of List Price: 99.03% |
Property Sales (Sold)
January property sales were 659, up 1.9% from 647 in January of 2024 and 26.5% lower than the 896 sales last month.
Current Inventory (For Sale)
Versus last year, the total number of properties available this month was higher by 407 units of 44.2%. This year’s bigger inventory means that buyers who waited to buy may have bigger selection to choose from. The number of current inventory was up 8.8% compared to the previous month.
Property Under Contract (Pended)
There was an increase of 8.9% in the pended properties in January, with 799 properties versus 734 last month. This month’s pended property sales were 0.6% higher than at this time last year.
The Average Sold Price per Square Footage was Neutral*
The Average Sold Price per Square Footage is a great indicator for the direction of property values. Since Median Sold Price and Average Sold Price can be impacted by the ‘mix’ of high or low end properties in the market, the Average Sold Price per Square Footage is a more normalized indicator on the direction of property values.
The January 2025 Average Sold Price per Square Footage of $338 was up 3% from $328 last month and up 5.3% from $321 in January of last year.
* Based on 6 month trend – Appreciating/Depreciating/Neutral
The Days on Market Showed Upward Trend*
The average Days on Market (DOM) shows how many days the average property is on the market before it sells. An upward trend in DOM trends to indicate a move towards more of a Buyer’s market, a downward trend indicates a move towards more of a Seller’s market. The DOM for January 2025 was 39, up 14.7% from 34 days last month and up 8.3% from 36 days in January of last year.
The Sold/Original List Price Ratio was Falling**
The Sold Price vs. Original List Price reveals the average amount that sellers are agreeing to come down from their original list price. The lower the ratio is below 100% the more of a Buyer’s market exists, a ratio at or above 100% indicates more of a Seller’s market. This month Sold Price vs. Original List Price of 97% was the same as last month and down from 1% % in January of last year.
* Based on 6 month trend – Upward/Downward/Neutral
** Based on 6 month trend – Rising/Falling/Remains Steady
The Average For Sale Price was Neutral*
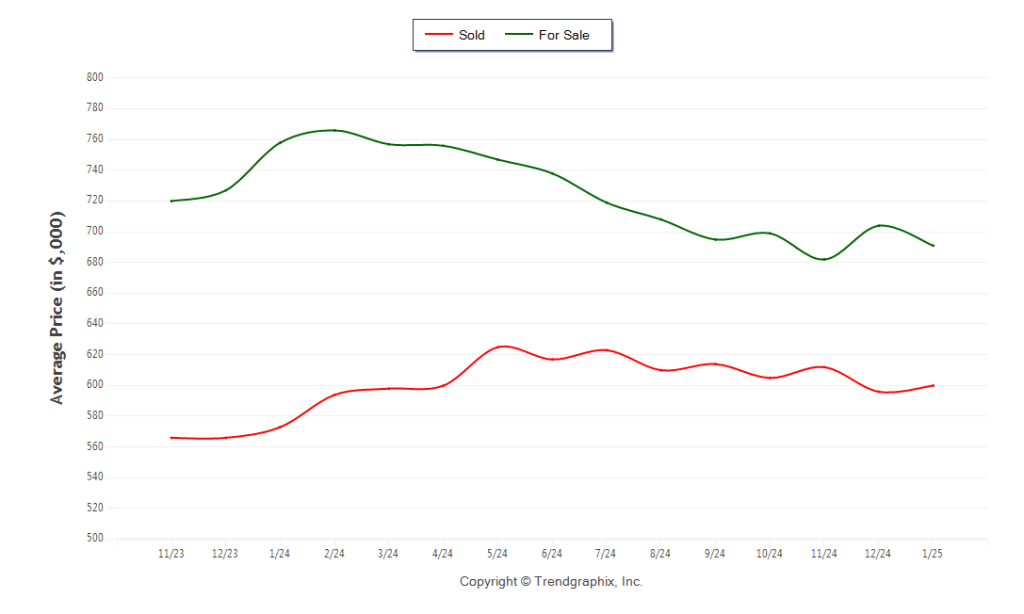
The Average For Sale Price in January was $691,000, down 8.8% from $758,000 in January of 2024 and down 1.8% from $704,000 last month.
The Average Sold Price was Neutral*
The Average Sold Price in January was $600,000, up 4.7% from $573,000 in January of 2024 and up 0.7% from $596,000 last month.
The Median Sold Price was Depreciating*
The Median Sold Price in January was $540,000, up 3.8% from $520,000 in January of 2024 and down 1.6% from $549,000 last month.
* Based on 6 month trend – Appreciating/Depreciating/Neutral
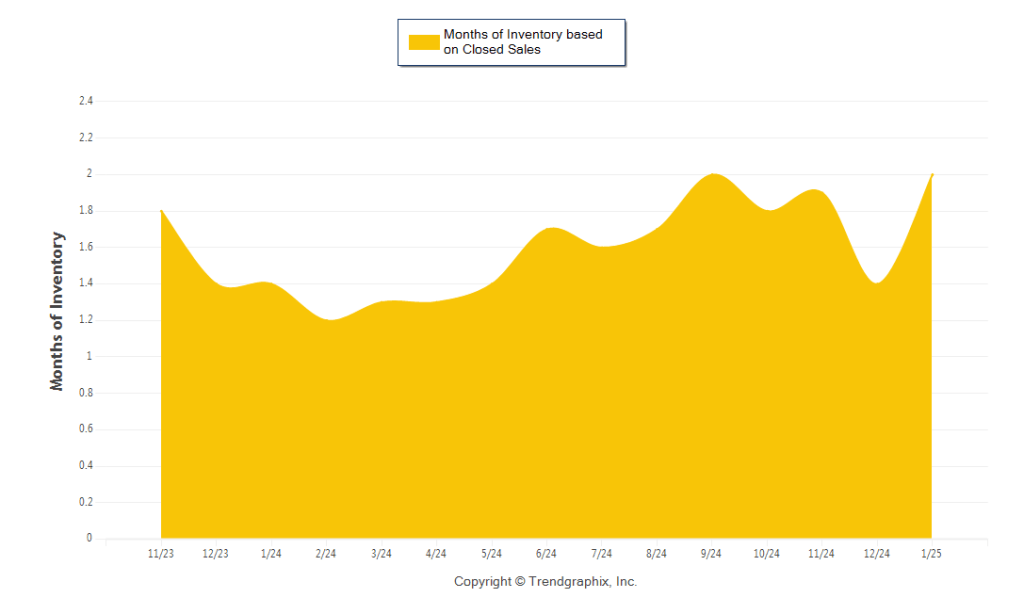
A comparatively lower Months of Inventory is more beneficial for sellers while a higher months of inventory is better for buyers.
*Buyer’s market: more than 6 months of inventory
Seller’s market: less than 3 months of inventory
Neutral market: 3 – 6 months of inventory
Months of Inventory based on Closed Sales
The January 2025 Months of Inventory based on Closed Sales of 2 was increased by 42.2% compared to last year and up 44.1% compared to last month. January 2025 was Seller’s market.
Months of Inventory based on Pended Sales
The January 2025 Months of Inventory based on Pended Sales of 1.7 was increased by 43.2% compared to last year and the same compared to last month. January 2025 was Seller’s market.