Housing Statistics - July 24
July 2024 was a Seller’s market! The number of for sale listings was up 51.2% from one year earlier and up 2.8% from the previous month. The number of sold listings increased 12.6% year over year and increased 8.7% month over month. The number of under contract listings was up 12.4% compared to previous month and up 22.5% compared to previous year. The Months of Inventory based on Closed Sales was 1.7, up 40.7% from the previous year.
The Average Sold Price per Square Footage was up 0.9% compared to previous month and up 3.6% compared to last year. The Median Sold Price decreased by 0.2% from last month. The Average Sold Price also increased by from last month. Based on the 6 month trend, the Average Sold Price trend was “Appreciating” and the Median Sold Price trend was “Neutral”.
The Average Days on Market showed a neutral trend, an increase of 47.1% compared to previous year. The ratio of Sold Price vs. Original List Price was 99%, a decrease of 1% compared to previous year.
| Category | Jul. 2024 vs. Jun. 2024 | % Change | Jul. 2024 vs. Jul. 2023 | % Change | May-Jul. 2024 vs. May-Jul. 2023 | % Change |
|---|---|---|---|---|---|---|
| For Sale | 6,430 vs. 6,230 | 3.2% up | 6,430 vs. 4,458 | 44.2% up | 6,430 vs. 4,458 | 44.2% up |
| Sold | 2,856 vs. 2,786 | 2.5% up | 2,856 vs. 2,677 | 6.7% up | 8,747 vs. 8,735 | 0.1% up |
| Pended | 3,192 vs. 2,824 | 13% up | 3,192 vs. 2,690 | 18.7% up | 9,123 vs. 8,542 | 6.8% up |
| Avg. Sq. Ft. Price (Sold) | 330 vs. 332 | 0.6% down | 330 vs. 319 | 3.4% up | 331 vs. 319 | 3.8% up |
| Avg. Active Price | 771 vs. 782 | 1.4% down | 771 vs. 809 | 4.7% down | 782 vs. 821 | 4.8% down |
| Avg. Sold Price | 638 vs. 643 | 0.8% down | 638 vs. 612 | 4.2% up | 637 vs. 613 | 3.9% up |
| Avg. Days on Market | 28 vs. 27 | 3.7% up | 28 vs. 23 | 21.7% up | 27 vs. 26 | 3.8% up |
| Sold/Orig LP Diff. % | 98 vs. 98 | 0% | 98 vs. 99 | 1% down | 98 vs. 99 | 1% down |
| Months of Inventory (Closed Sales) | 2.3 vs. 2.2 | 4.5% up | 2.3 vs. 1.7 | 36% up | 2.2 vs. 1.5 | 45.7% up |
| Residential | 2 Bedrooms | 3 Bedrooms | 4 Bedrooms | 5+ Bedrooms | All Bedrooms |
|---|---|---|---|---|---|
| All Off Market | #Units: 99 | #Units: 511 | #Units: 343 | #Units: 65 | #Units: 1018 |
| Closed |
Dollar Value: $48,685,201 Average List Price: $491,419 Average Close Price: $491,770 Average Market Time: 24 Average Square Feet: 1205 % of List Price: 100.07 |
Dollar Value: $290,181,767 Average List Price: $564,083 Average Close Price: $567,870 Average Market Time: 21 Average Square Feet: 1555 % of List Price: 100.67 |
Dollar Value: $243,898,038 Average List Price: $711,736 Average Close Price: $711,073 Average Market Time: 27 Average Square Feet: 2159 % of List Price: 99.91 |
Dollar Value: $56,142,588 Average List Price: $856,061 Average Close Price: $863,732 Average Market Time: 30 Average Square Feet: 2871 % of List Price: 100.90 |
Dollar Value: $638,907,594 Average List Price: $625,409 Average Close Price: $627,611 Average Market Time: 24 Average Square Feet: 1808 % of List Price: 100.35 |
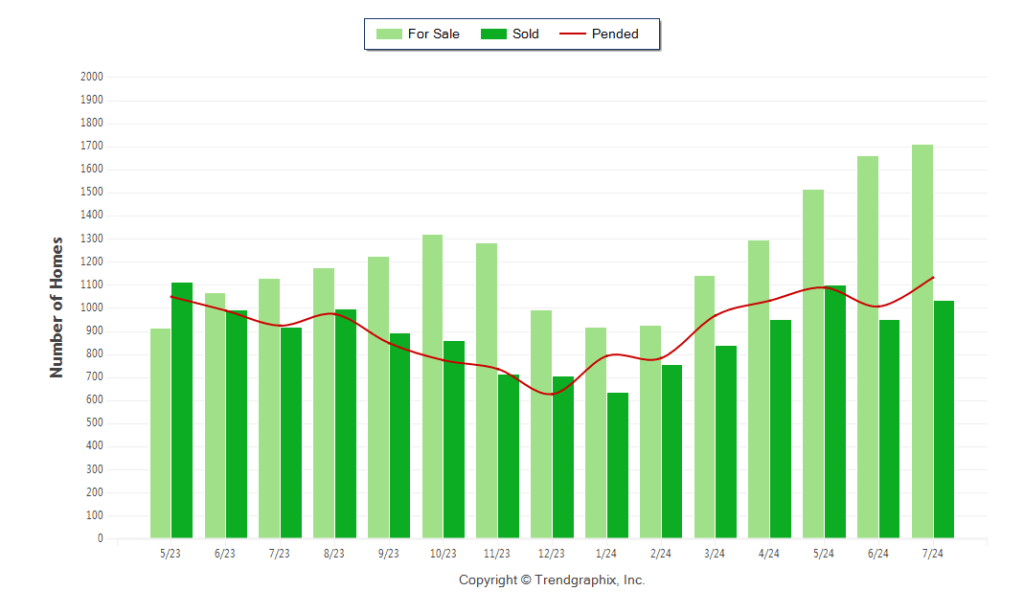
Property Sales (Sold)
July property sales were 1,036, up 12.6% from 920 in July of 2023 and 8.7% higher than the 953 sales last month.
Current Inventory (For Sale)
Versus last year, the total number of properties available this month was higher by 579 units of 51.2%. This year’s bigger inventory means that buyers who waited to buy may have bigger selection to choose from. The number of current inventory was up 2.8% compared to the previous month.
Property Under Contract (Pended)
There was an increase of 12.4% in the pended properties in July, with 1,134 properties versus 1,009 last month. This month’s pended property sales were 22.5% higher than at this time last year.
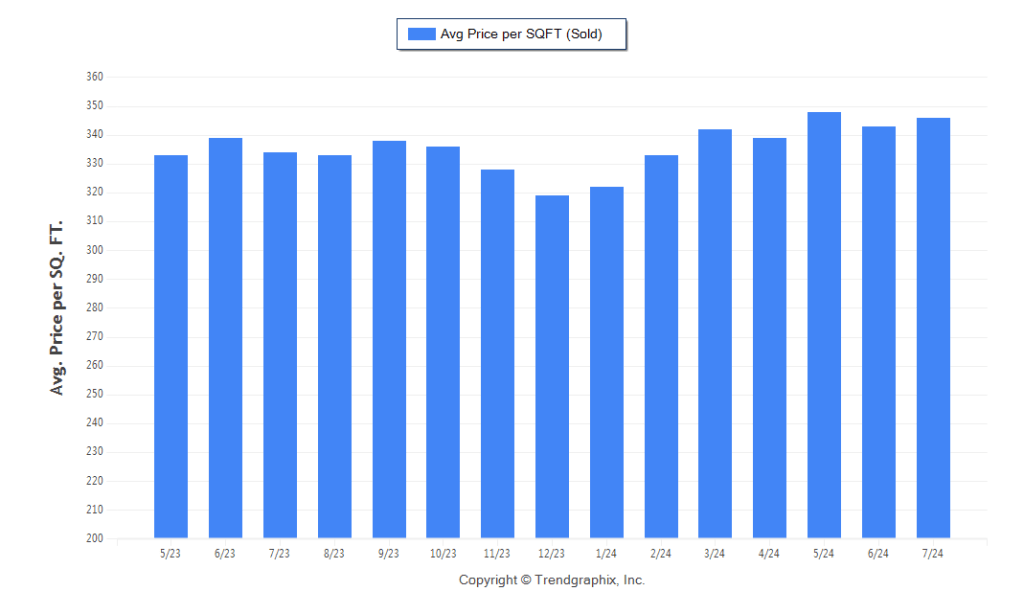
The Average Sold Price per Square Footage was Neutral*
The Average Sold Price per Square Footage is a great indicator for the direction of property values. Since Median Sold Price and Average Sold Price can be impacted by the ‘mix’ of high or low end properties in the market, the Average Sold Price per Square Footage is a more normalized indicator on the direction of property values. The July 2024 Average Sold Price per Square Footage of $346 was up 0.9% from $343 last month and up 3.6% from $334 in July of last year.
* Based on 6 month trend – Appreciating/Depreciating/Neutral
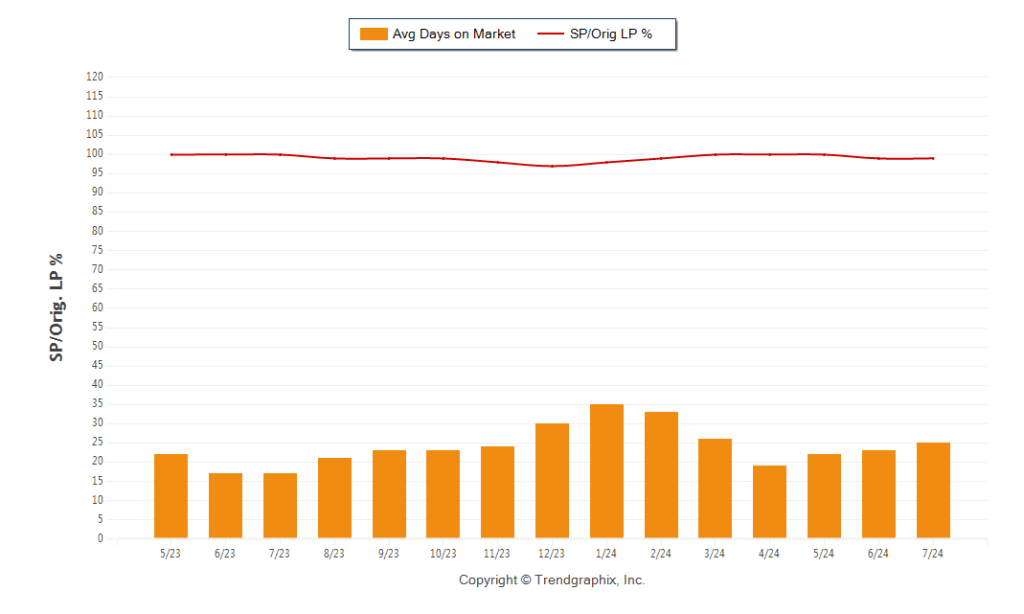
The Days on Market Showed Neutral Trend*
The average Days on Market (DOM) shows how many days the average property is on the market before it sells. An upward trend in DOM trends to indicate a move towards more of a Buyer’s market, a downward trend indicates a move towards more of a Seller’s market. The DOM for July 2024 was 25, up 8.7% from 23 days last month and up 47.1% from 17 days in July of last year.
The Sold/Original List Price Ratio Remains Steady**
The Sold Price vs. Original List Price reveals the average amount that sellers are agreeing to come down from their original list price. The lower the ratio is below 100% the more of a Buyer’s market exists, a ratio at or above 100% indicates more of a Seller’s market. This month Sold Price vs. Original
List Price of 99% was the same as last month and down from 1% % in July of last year.
* Based on 6 month trend – Upward/Downward/Neutral
** Based on 6 month trend – Rising/Falling/Remains Steady
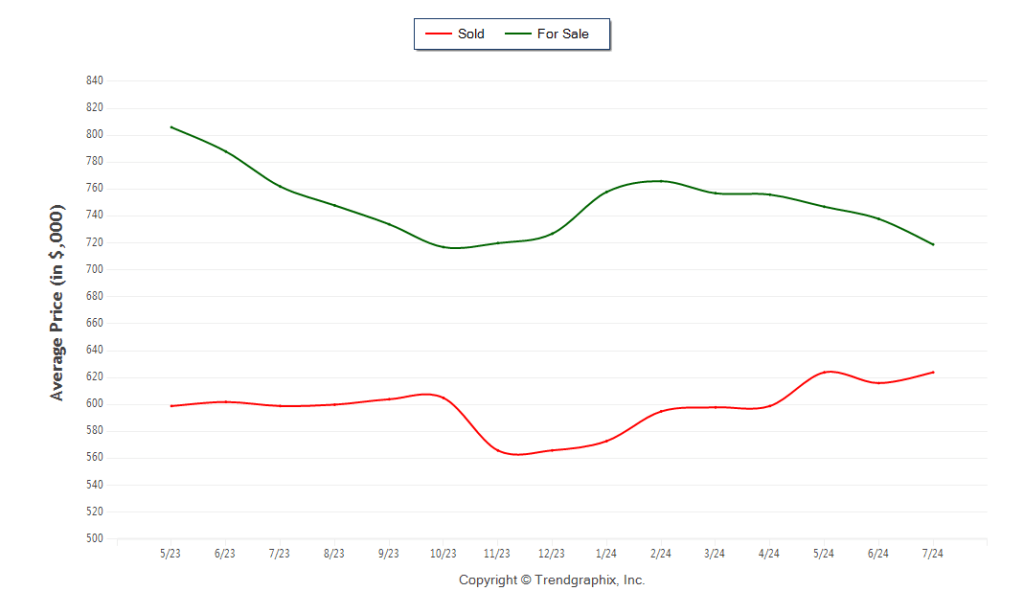
The Average For Sale Price was Depreciating*
The Average For Sale Price in July was $719,000, down 5.6% from $762,000 in July of 2023 and down 2.6% from $738,000 last month
The Average Sold Price was Appreciating*
The Average Sold Price in July was $624,000, up 4.2% from $599,000 in July of 2023 and up 1.3% from $616,000 last month.
The Median Sold Price was Neutral*
The Median Sold Price in July was $560,000, up 2.4% from $547,000 in July of 2023 and down 0.2% from $561,000 last month
* Based on 6 month trend – Appreciating/Depreciating/Neutral
A comparatively lower Months of Inventory is more beneficial for sellers while a higher months of inventory is better for buyers.
- *Buyer’s market: more than 6 months of inventory
- Seller’s market: less than 3 months of inventory
- Neutral market: 3 – 6 months of inventory
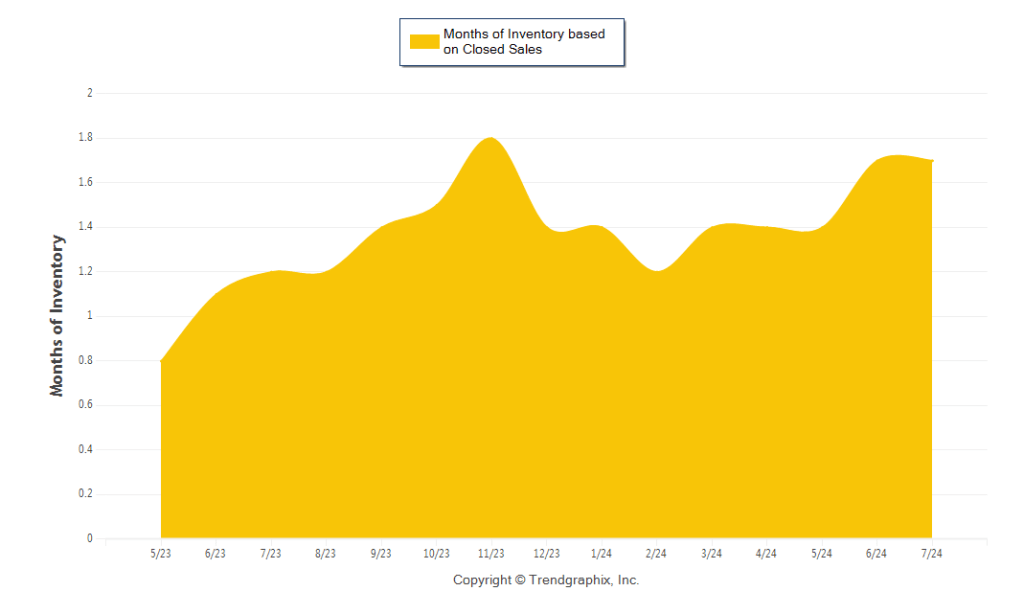
Months of Inventory based on Closed Sales
The July 2024 Months of Inventory based on Closed Sales of 1.7 was increased by 40.7% compared to last year and the same compared to last month. July 2024 was Seller’s market.
Months of Inventory based on Pended Sales
The July 2024 Months of Inventory based on Pended Sales of 1.5 was increased by 24.6% compared to last year and down 6.1% compared to last month. July 2024 was Seller’s market.