Housing Statistics - August 24
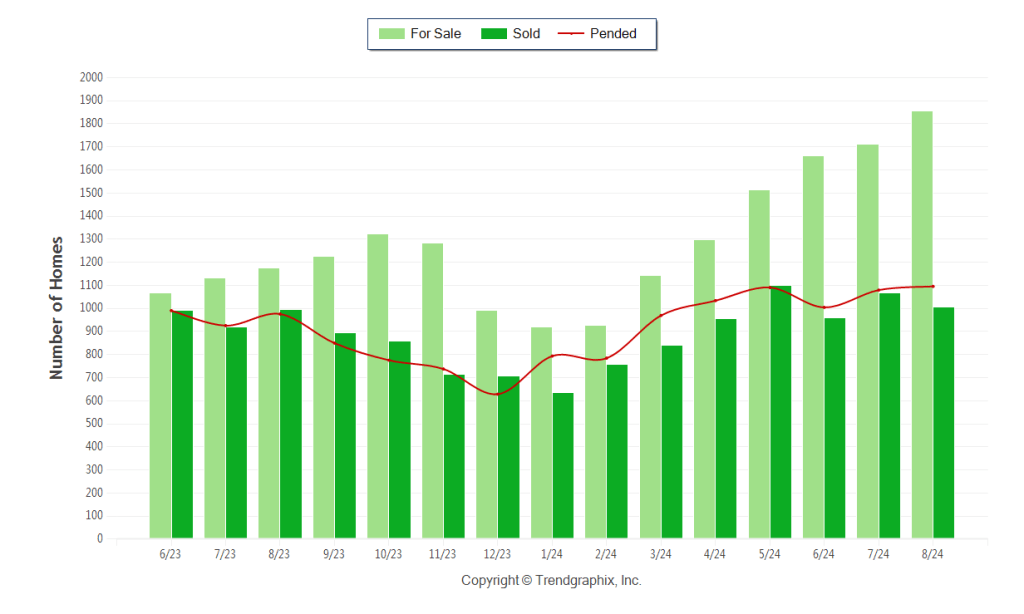
August 2024 was a Seller’s market! The number of for sale listings was up 58% from one year earlier and up 8.5% from the previous month. The number of sold listings increased 0.8% year over year and decreased 5.8% month over month. The number of under contract listings was up 1.5% compared to previous month and up 12.3% compared to previous year. The Months of Inventory based on Closed Sales was 1.8, up 51% from the previous year.
- The Average Sold Price per Square Footage was down 1.7% compared to previous month and up 1.8% compared to last year.
- The Median Sold Price decreased by 0.2% from last month. The Average Sold Price also decreased by 1.6% from last month.
- Based on the 6 month trend, the Average Sold Price trend was “Neutral” and the Median Sold Price trend was “Neutral”.
- The Average Days on Market showed a neutral trend, an increase of 14.3% compared to previous year. The ratio of Sold Price vs. Original List Price was 98%, a decrease of 1% compared to previous year.
| Category | Aug. 2024 vs. Jul. 2024 | % Change | Aug. 2024 vs. Aug. 2023 | % Change | Jun. 2024 to Aug. 2024 vs. Previous Year | % Change |
|---|---|---|---|---|---|---|
| For Sale | 1,855 vs. 1,710 | 8.5% up | 1,855 vs. 1,174 | 58% up | 1,855 vs. 1,174 | 58% up |
| Sold | 1,005 vs. 1,067 | -5.8% down | 1,005 vs. 997 | 0.8% up | 3,031 vs. 2,909 | 4.2% up |
| Pended | 1,096 vs. 1,080 | 1.5% up | 1,096 vs. 976 | 12.3% up | 3,181 vs. 2,893 | 10% up |
| Avg. Sq. Ft. Price (Sold) | 339 vs. 345 | -1.7% down | 339 vs. 333 | 1.8% up | 343 vs. 335 | 2.4% up |
| Avg Days on Market | 24 vs. 25 | -4% down | 24 vs. 21 | 14.3% up | 24 vs. 18 | 33.3% up |
| Sold/List Diff. % | 100 vs. 100 | 0% | 100 vs. 100 | 0% | 100 vs. 101 | -1% down |
| Months of Inventory (Closed Sales) | 1.8 vs. 1.6 | 12.5% up | 1.8 vs. 1.2 | 51% up | 1.8 vs. 1.2 | 49.6% up |
| Residential | 2 Bedrooms | 3 Bedrooms | 4 Bedrooms | 5+ Bedrooms | All Bedrooms |
|---|---|---|---|---|---|
| All Off Market | #Units: 99 | #Units: 511 | #Units: 343 | #Units: 65 | #Units: 1018 |
| Closed |
Dollar Value: $48,685,201 Average List Price: $491,419 Average Close Price: $491,770 Average Market Time: 24 Average Square Feet: 1205 % of List Price: 100.07 |
Dollar Value: $290,181,767 Average List Price: $564,083 Average Close Price: $567,870 Average Market Time: 21 Average Square Feet: 1555 % of List Price: 100.67 |
Dollar Value: $243,898,038 Average List Price: $711,736 Average Close Price: $711,073 Average Market Time: 27 Average Square Feet: 2159 % of List Price: 99.91 |
Dollar Value: $56,142,588 Average List Price: $856,061 Average Close Price: $863,732 Average Market Time: 30 Average Square Feet: 2871 % of List Price: 100.90 |
Dollar Value: $638,907,594 Average List Price: $625,409 Average Close Price: $627,611 Average Market Time: 24 Average Square Feet: 1808 % of List Price: 100.35 |
Property Sales (Sold)
August property sales were 1,005, up 0.8% from 997 in August of 2023 and 5.8% lower than the 1,067 sales last month.
Current Inventory (For Sale)
Versus last year, the total number of properties available this month was higher by 681 units of 58%. This year’s bigger inventory means that buyers who waited to buy may have bigger selection to choose from. The number of current inventory was up 8.5% compared to the previous month.
Property Under Contract (Pended)
There was an increase of 1.5% in the pended properties in August, with 1,096 properties versus 1,080 last month. This month’s pended property sales were 12.3% higher than at this time last year.
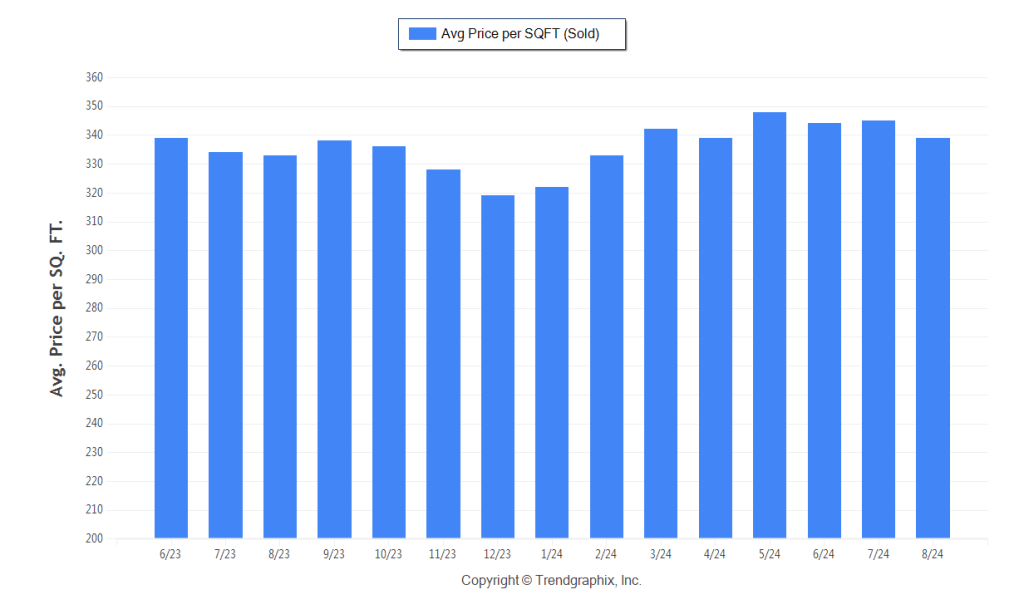
The Average Sold Price per Square Footage was Depreciating*
The Average Sold Price per Square Footage is a great indicator for the direction of property values. Since Median Sold Price and Average Sold Price can be impacted by the ‘mix’ of high or low end properties in the market, the Average Sold Price per Square Footage is a more normalized indicator on the direction of property values. The August 2024 Average Sold Price per Square Footage of $339 was down 1.7% from $345 last month and up 1.8% from $333 in August of last year.
* Based on 6 month trend – Appreciating/Depreciating/Neutral
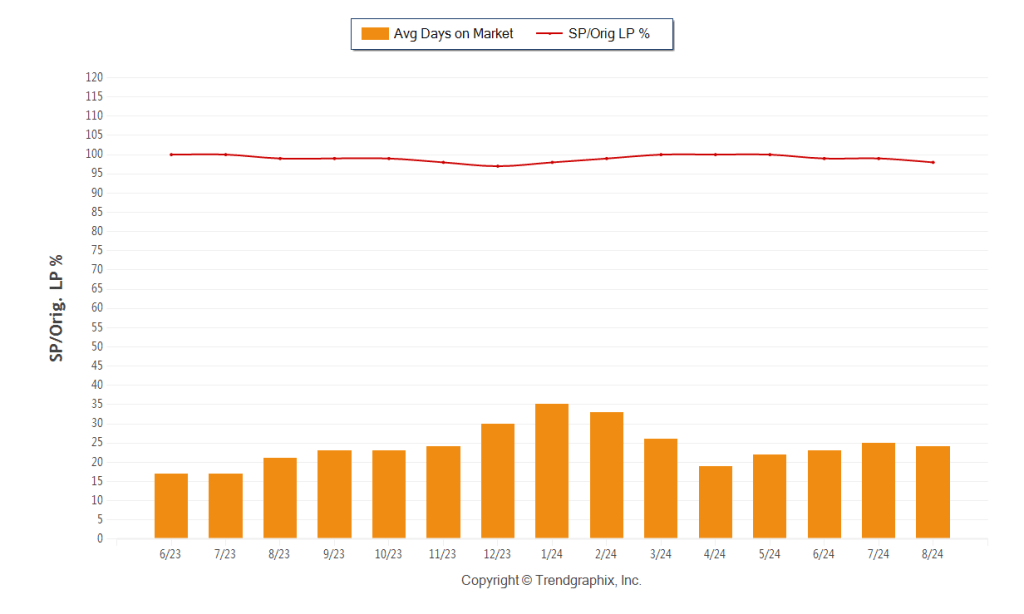
The Days on Market Showed Neutral Trend*
The average Days on Market (DOM) shows how many days the average property is on the market before it sells. An upward trend in DOM trends to indicate a move towards more of a Buyer’s market, a downward trend indicates a move towards more of a Seller’s market. The DOM for August 2024 was 24, down 4% from 25 days last month and up 14.3% from 21 days in August of last year.
The Sold/Original List Price Ratio was Falling**
The Sold Price vs. Original List Price reveals the average amount that sellers are agreeing to come down from their original list price. The lower the ratio is below 100% the more of a Buyer’s market exists, a ratio at or above 100% indicates more of a Seller’s market. This month Sold Price vs. Original List Price of 98% was down 1% % from last month and down from 1% % in August of last year.
* Based on 6 month trend – Upward/Downward/Neutral
** Based on 6 month trend – Rising/Falling/Remains Steady
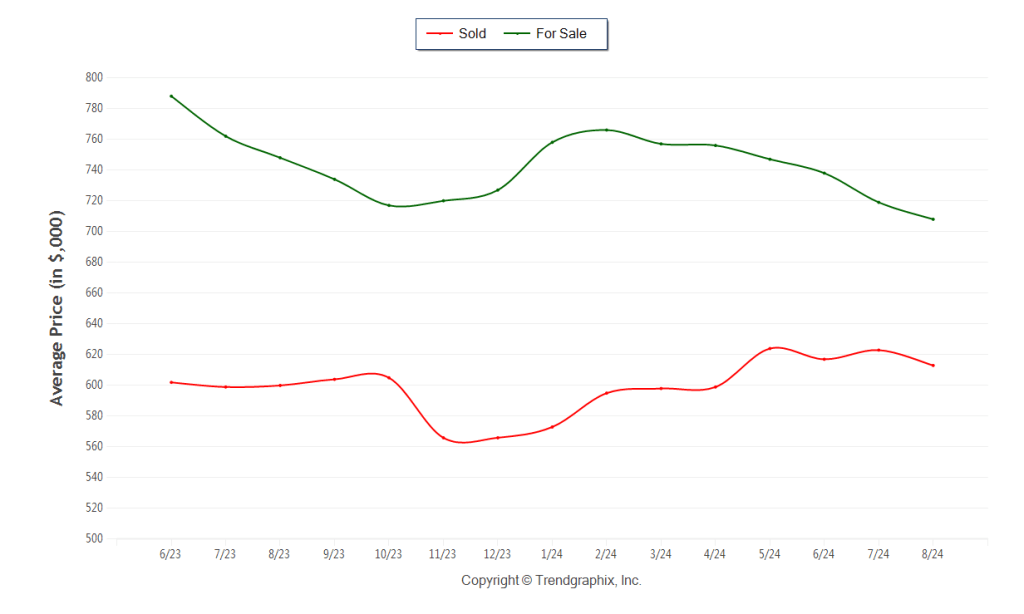
The Average For Sale Price was Depreciating*
The Average For Sale Price in August was $708,000, down 5.3% from $748,000 in August of 2023 and down 1.5% from $719,000 last month.
The Average Sold Price was Neutral*
The Average Sold Price in August was $613,000, up 2.2% from $600,000 in August of 2023 and down 1.6% from $623,000 last month.
The Median Sold Price was Neutral*
The Median Sold Price in August was $559,000, up 3.7% from $539,000 in August of 2023 and down 0.2% from $560,000 last month.
* Based on 6 month trend – Appreciating/Depreciating/Neutral
A comparatively lower Months of Inventory is more beneficial for sellers while a higher months of inventory is better for buyers.
*Buyer’s market: more than 6 months of inventory
Seller’s market: less than 3 months of inventory
Neutral market: 3 – 6 months of inventory
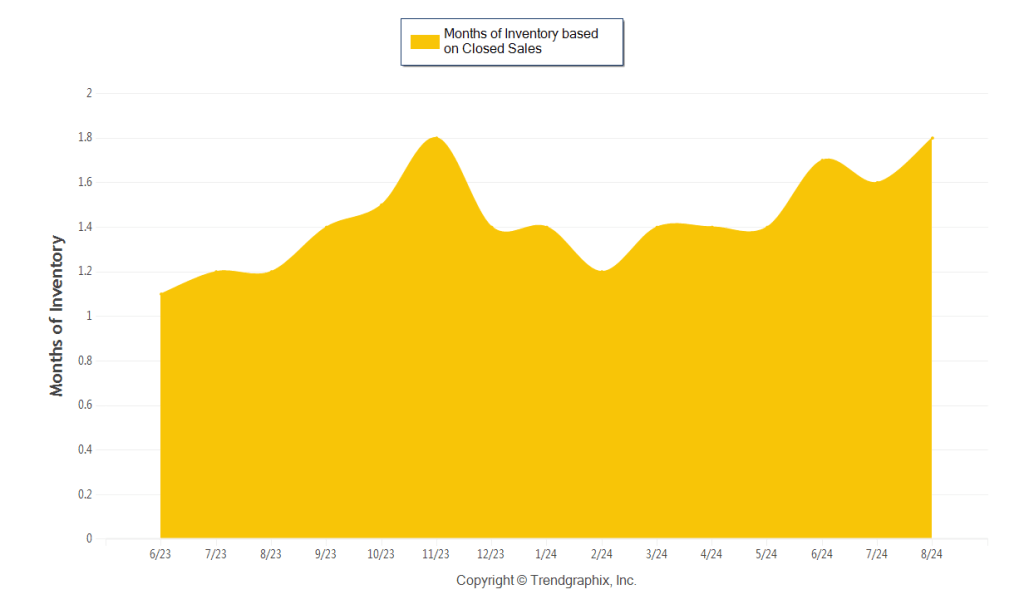
Months of Inventory based on Closed Sales
The August 2024 Months of Inventory based on Closed Sales of 1.8 was increased by 51% compared to last year and up 12.5% compared to last month. August 2024 was Seller’s market.
Months of Inventory based on Pended Sales
The August 2024 Months of Inventory based on Pended Sales of 1.7 was increased by 41.6% compared to last year and up 6.3% compared to last month. August 2024 was Seller’s market.