Housing Statistics - September 24
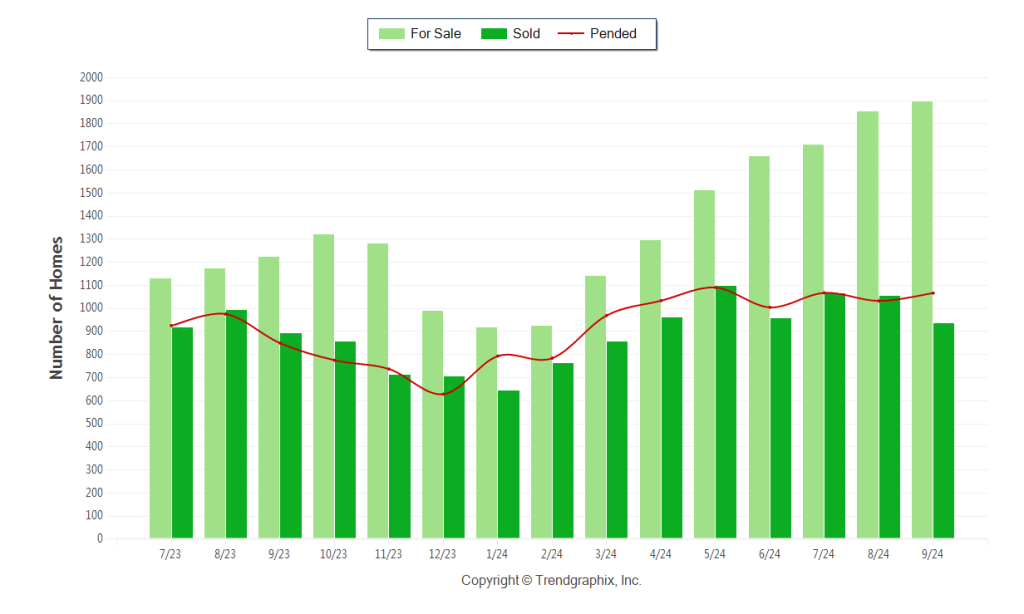
September 2024 was a Seller’s market! The number of for sale listings was up 54.9% from one year earlier and up 2.3% from the previous month. The number of sold listings increased 4.9% year over year and decreased 11% month over month. The number of under contract listings was up 3.3% compared to previous month and up 25.5% compared to previous year. The Months of Inventory based on Closed Sales was 2, up 43.8% from the previous year.
-
The Average Sold Price per Square Footage was the same as compared to previous month and up 0.3% compared to last year.
-
The Median Sold Price increased by 0.9% from last month. The Average Sold Price also increased by 0.5% from last month.
- Based on the 6 month trend, the Average Sold Price trend was “Neutral” and the Median Sold Price trend was “Appreciating”.
The Average Days on Market showed a upward trend, an increase of 17.4% compared to previous year. The ratio of Sold Price vs. Original List Price was 98%, a decrease of 1% compared to previous year.
| Category | Sep. 2024 vs. Aug. 2024 | % Change | Sep. 2024 vs. Sep. 2023 | % Change | Jul. 2024 to Sep. 2024 vs. Previous Year | % Change |
|---|---|---|---|---|---|---|
| For Sale | 1,898 vs. 1,855 | 2.3% up | 1,898 vs. 1,225 | 54.9% up | 1,898 vs. 1,225 | 54.9% up |
| Sold | 939 vs. 1,055 | -11% down | 939 vs. 895 | 4.9% up | 3,063 vs. 2,812 | 8.9% up |
| Pended | 1,067 vs. 1,033 | 3.3% up | 1,067 vs. 850 | 25.5% up | 3,168 vs. 2,752 | 15.1% up |
| Avg. Sq. Ft. Price (Sold) | 339 vs. 339 | 0% | 339 vs. 338 | 0.3% up | 341 vs. 335 | 1.8% up |
| Avg Days on Market | 27 vs. 25 | 8% up | 27 vs. 23 | 17.4% up | 26 vs. 20 | 30% up |
| Sold/List Diff. % | 98 vs. 98 | 0% | 98 vs. 99 | -1% down | 98 vs. 99 | -1% down |
| Avg. Active Price | 695 vs. 708 | -1.8% down | 695 vs. 734 | -5.3% down | 707 vs. 748 | -5.5% down |
| Avg. Sold Price | 614 vs. 611 | 0.5% up | 614 vs. 604 | 1.7% up | 616 vs. 601 | 2.5% up |
| Months of Inventory (Closed Sales) | 2 vs. 1.8 | 11.4% up | 2 vs. 1.4 | 43.8% up | 1.9 vs. 1.3 | 45.9% up |
| Residential | 2 Bedrooms | 3 Bedrooms | 4 Bedrooms | 5+ Bedrooms | All Bedrooms |
|---|---|---|---|---|---|
| All Off Market | #Units: 89 | #Units: 476 | #Units: 367 | #Units: 0 | #Units: 932 |
| Closed |
Dollar Value: $40,937,871 Average List Price: $459,976 Average Close Price: $459,976 Average Market Time: N/A Average Square Feet: N/A % of List Price: N/A |
Dollar Value: $260,495,998 Average List Price: $547,261 Average Close Price: $547,261 Average Market Time: N/A Average Square Feet: N/A % of List Price: N/A |
Dollar Value: $268,452,955 Average List Price: $731,479 Average Close Price: $731,479 Average Market Time: N/A Average Square Feet: N/A % of List Price: N/A |
Dollar Value: $569,886,824 Average List Price: $611,467 Average Close Price: $611,467 Average Market Time: N/A Average Square Feet: N/A % of List Price: N/A |
Dollar Value: $1,359,940,775 Average List Price: $684,419 Average Close Price: $684,419 Average Market Time: N/A Average Square Feet: N/A % of List Price: N/A |
Property Sales (Sold)
September property sales were 939, up 4.9% from 895 in September of 2023 and 11% lower than the 1,055 sales last month.
Current Inventory (For Sale)
Versus last year, the total number of properties available this month was higher by 673 units of 54.9%. This year’s bigger inventory means that buyers who waited to buy may have bigger selection to choose from. The number of current inventory was up 2.3% compared to the previous month.
Property Under Contract (Pended)
There was an increase of 3.3% in the pended properties in September, with 1,067 properties versus 1,033 last month. This month’s pended property sales were 25.5% higher than at this time last year.
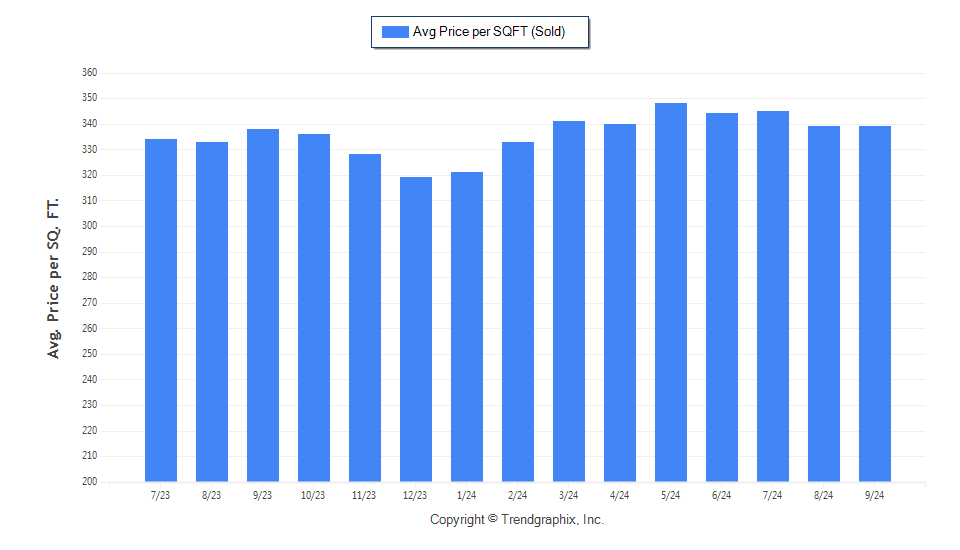
The Average Sold Price per Square Footage was Depreciating*
The Average Sold Price per Square Footage is a great indicator for the direction of property values. Since Median Sold Price and Average Sold Price can be impacted by the ‘mix’ of high or low end properties in the market, the Average Sold Price per Square Footage is a more normalized indicator on the direction of property values. The September 2024 Average Sold Price per Square Footage of $339 was the same as last month and up 0.3% from $338 in September of last year.
* Based on 6 month trend – Appreciating/Depreciating/Neutral
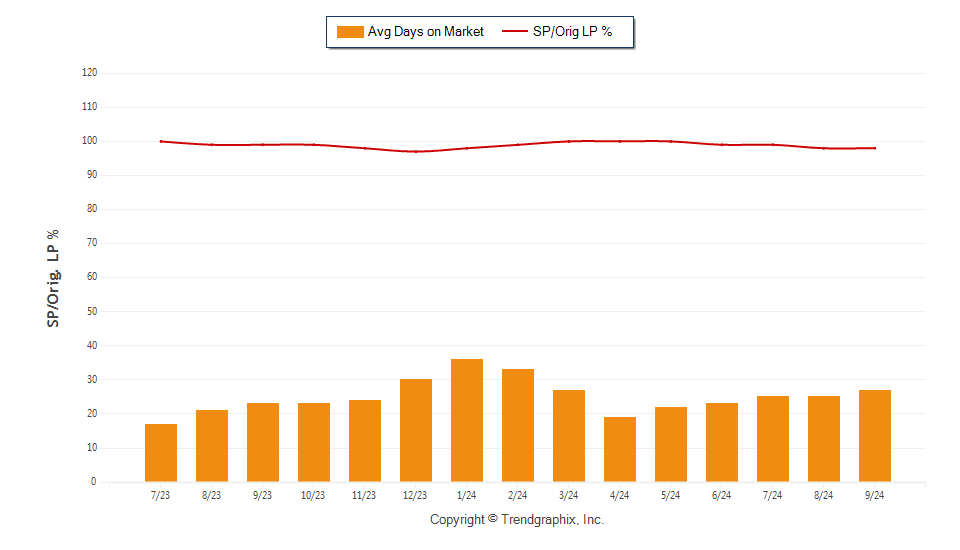
The Days on Market Showed Neutral Trend*
The average Days on Market (DOM) shows how many days the average property is on the market before it sells. An upward trend in DOM trends to indicate a move towards more of a Buyer’s market, a downward trend indicates a move towards more of a Seller’s market. The DOM for September 2024 was 27, up 8% from 25 days last month and up 17.4% from 23 days in September of last year.
The Sold/Original List Price Ratio was Falling**
The Sold Price vs. Original List Price reveals the average
amount that sellers are agreeing to come down from their
original list price. The lower the ratio is below 100% the more of
a Buyer’s market exists, a ratio at or above 100% indicates
more of a Seller’s market. This month Sold Price vs. Original
List Price of 98% was the same as last month and down from
1% in September of last year.
* Based on 6 month trend – Upward/Downward/Neutral
** Based on 6 month trend – Rising/Falling/Remains Steady
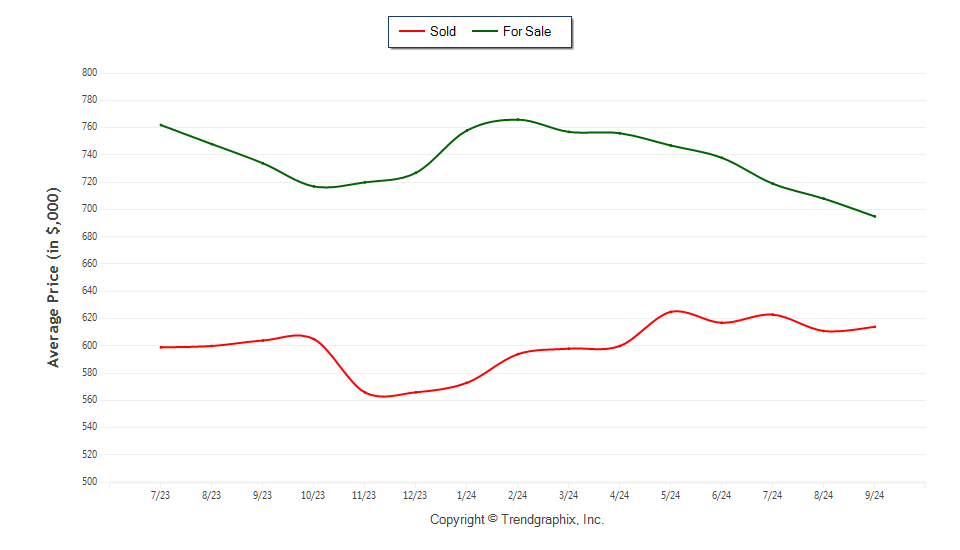
The Average For Sale Price was Depreciating*
The Average For Sale Price in September was $695,000, down
5.3% from $734,000 in September of 2023 and down 1.8%
from $708,000 last month.
The Average Sold Price was Neutral*
The Average Sold Price in September was $614,000, up 1.7%
from $604,000 in September of 2023 and up 0.5% from
$611,000 last month.
The Median Sold Price was Neutral*
The Median Sold Price in September was $560,000, up 2.8%
from $545,000 in September of 2023 and up 0.9% from
$555,000 last month.
* Based on 6 month trend – Appreciating/Depreciating/Neutral
A comparatively lower Months of Inventory is more beneficial for sellers while a higher months of inventory is better for buyers.
*Buyer’s market: more than 6 months of inventory
Seller’s market: less than 3 months of inventory
Neutral market: 3 – 6 months of inventory
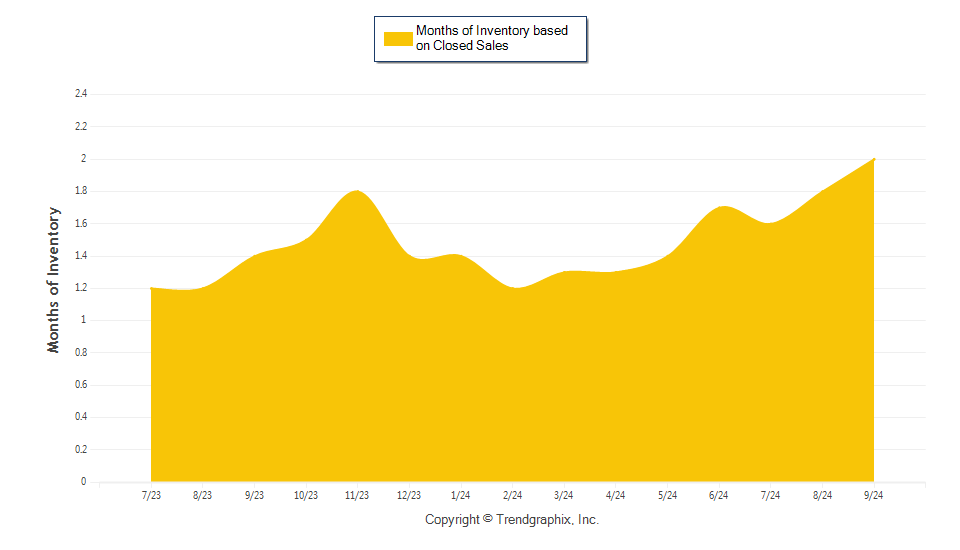
Months of Inventory based on Closed Sales
The September 2024 Months of Inventory based on Closed
Sales of 2 was increased by 43.8% compared to last year and
up 11.4% compared to last month. September 2024 was
Seller’s market.
Months of Inventory based on Pended Sales
The September 2024 Months of Inventory based on Pended
Sales of 1.8 was increased by 27.8% compared to last year
and the same compared to last month. September 2024 was
Seller’s market.