

The December 2025 housing market remained in seller-favorable territory, though signs of moderation continued across several key indicators. Inventory levels increased year over year, while pricing trends and buyer activity reflected a more balanced and disciplined market environment.
Inventory & Supply
Active listings increased 18.5% compared to December 2024, providing buyers with expanded options. However, inventory declined 24.8% from the previous month, reflecting typical seasonal contraction. Months of Inventory based on closed sales measured 1.7 months, up 22% year over year, signaling gradual supply normalization.
Sales Activity
Closed sales totaled 849 properties, down 5.1% year over year but up 1.6% from November. Pending sales decreased 12.4% month over month and were 1.6% lower than last year, indicating moderated buyer momentum entering the winter season.
Pricing Trends
The Median Sold Price increased modestly by 0.2% from the prior month, while the Average Sold Price declined 1.2%. On a price-per-square-foot basis, the market remained stable year over year at $328, though down 1.5% from November.
Over the six-month trend period:
Average Sold Price showed a depreciating trend.
Median Sold Price remained neutral.
Average Days on Market increased 38.2% year over year.
The Sold Price to Original List Price ratio declined to 96–97%, reflecting more measured negotiation dynamics.
| Category | Dec. 2025 vs. Nov. 2025 | % Change | Dec. 2025 vs. Dec. 2024 | % Change | Oct.–Dec. 2025 vs. Oct.–Dec. 2024 | % Change |
|---|---|---|---|---|---|---|
| For Sale | 1,446 vs. 1,924 | -24.8% down | 1,446 vs. 1,220 | 18.5% up | 1,446 vs. 1,220 | 18.5% up |
| Sold | 849 vs. 836 | 1.6% up | 849 vs. 895 | -5.1% down | 2,685 vs. 2,811 | -4.5% down |
| Pended | 726 vs. 829 | -12.4% down | 726 vs. 738 | -1.6% down | 2,539 vs. 2,549 | -0.4% down |
| Avg. Sq. Ft. Price (Sold) | 328 vs. 333 | -1.5% down | 328 vs. 328 | 0% | 330 vs. 336 | -1.8% down |
| Avg. Days on Market | 47 vs. 40 | 17.5% up | 47 vs. 34 | 38.2% up | 43 vs. 31 | 38.7% up |
| Sold/Orig LP Diff. % | 96 vs. 97 | -1% down | 96 vs. 97 | -1% down | 97 vs. 98 | -1% down |
| Avg. Active Price | 690 vs. 693 | -0.4% down | 690 vs. 704 | -2% down | 687 vs. 694 | -1% down |
| Avg. Sold Price | 580 vs. 587 | -1.2% down | 580 vs. 595 | -2.5% down | 589 vs. 604 | -2.5% down |
| Months of Inventory (Closed Sales) | 1.7 vs. 2.3 | -26.1% down | 1.7 vs. 1.4 | 22% up | 1.6 vs. 1.3 | 23% up |
| Residential | 2 Bedrooms | 3 Bedrooms | 4 Bedrooms | 5+ Bedrooms | All Bedrooms |
|---|---|---|---|---|---|
| Closed |
#Units: 182 Dollar Value: $70,692,033 Average List Price: $395,584 Average Close Price: $388,418 Average Market Time: 58 Average Square Feet: 1,156 % of List Price: 98.19% |
#Units: 504 Dollar Value: $264,325,026 Average List Price: $528,776 Average Close Price: $524,454 Average Market Time: 45 Average Square Feet: 1,535 % of List Price: 99.18% |
#Units: 248 Dollar Value: $164,109,381 Average List Price: $671,314 Average Close Price: $661,731 Average Market Time: 47 Average Square Feet: 2,144 % of List Price: 98.57% |
#Units: 64 Dollar Value: $54,599,919 Average List Price: $872,865 Average Close Price: $853,124 Average Market Time: 55 Average Square Feet: 3,022 % of List Price: 97.74% |
#Units: 998 Dollar Value: $553,726,359 Average List Price: $561,973 Average Close Price: $554,836 Average Market Time: 49 Average Square Feet: 1,712 % of List Price: 98.73% |
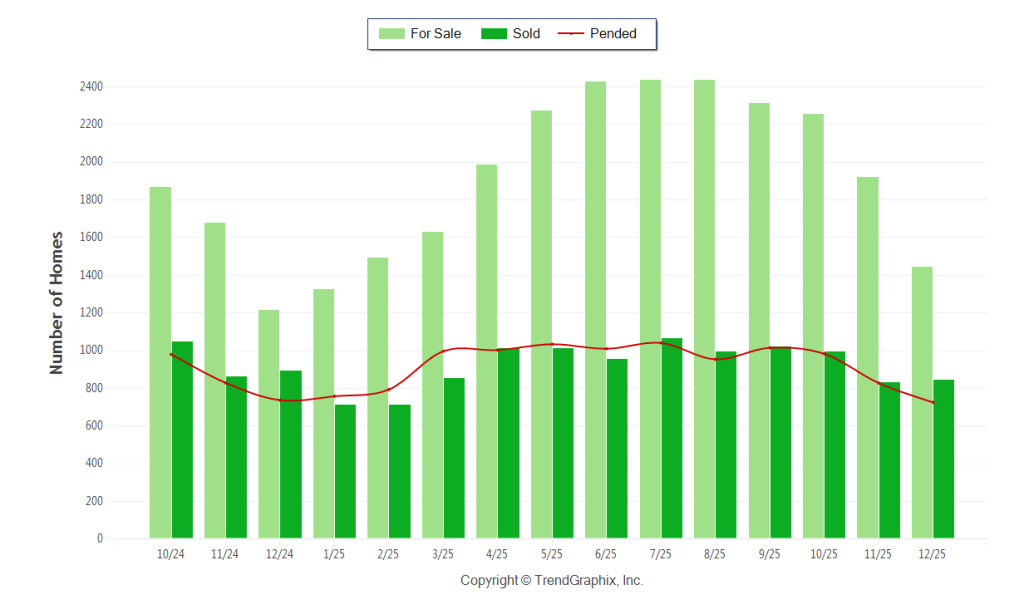
Property Sales (Sold)
December property sales were 849, down 5.1% from 895 in December of 2024 and 1.6% higher than the 836 sales last month.
Current Inventory (For Sale):
Compared to last year, the total number of properties available this month was higher by 226 units, an increase of 18.5%. This year’s larger inventory means buyers who waited to buy may have a bigger selection to choose from. The number of current inventory listings was down 24.8% compared to the previous month.
Property Under Contract (Pended):
There was a decrease of 12.4% in pended properties in December, with 726 properties versus 829 last month. This month’s pended property sales were 1.6% lower than at the same time last year.
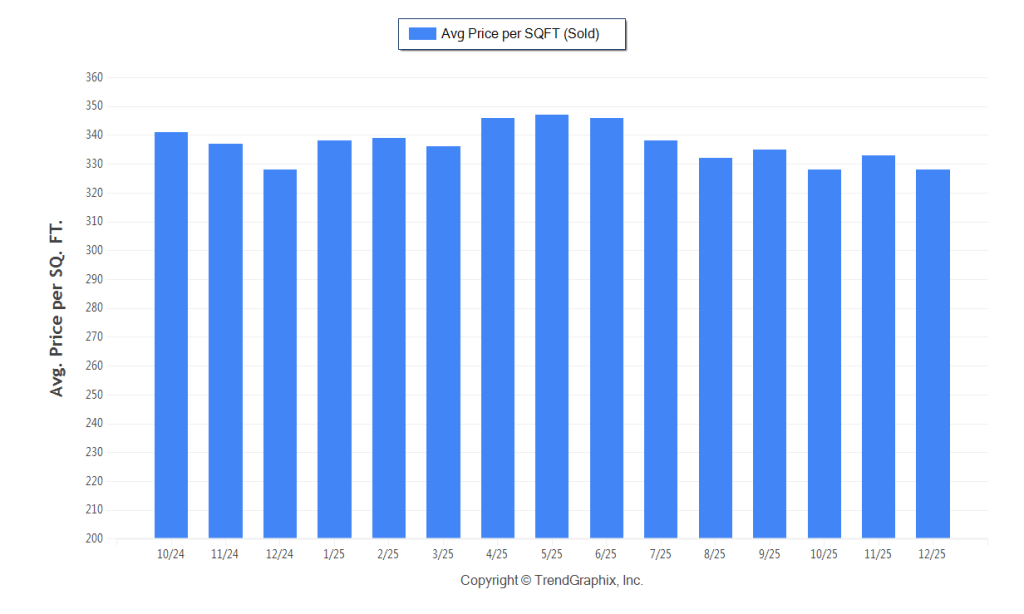
The Average Sold Price per Square Footage was Depreciating.*
The Average Sold Price per Square Footage is a key indicator for the direction of property values. Since Median Sold Price and Average Sold Price can be impacted by the mix of high- or low-end properties in the market, Average Sold Price per Square Footage is a more normalized indicator. The December 2025 Average Sold Price per Square Footage of $328 was down 1.5% from $333 last month and the same as December of last year
* Based on 6 month trend – Appreciating/Depreciating/Neutral
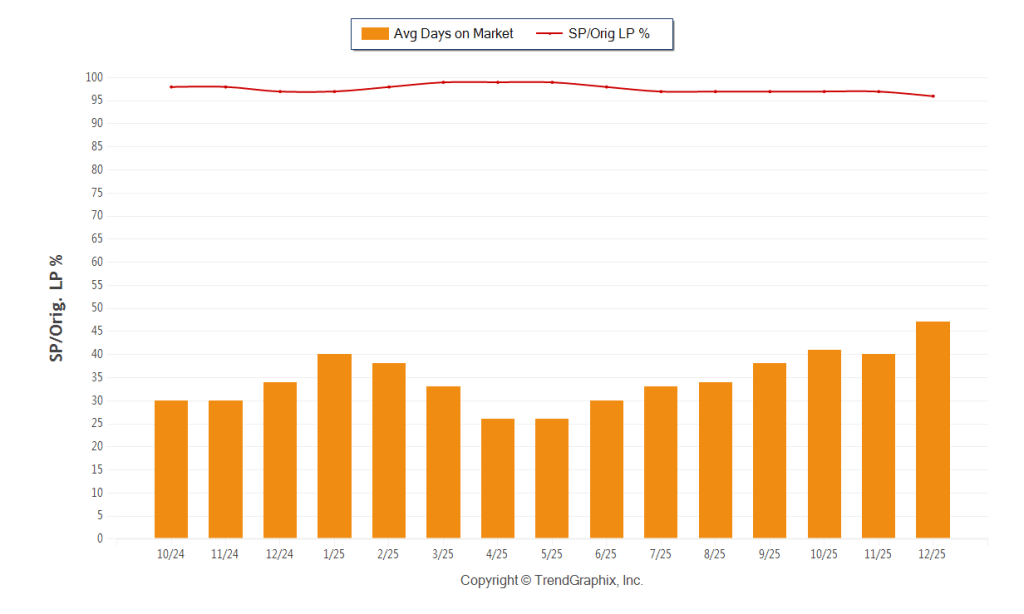
The Days on Market showed an upward trend.
The average Days on Market indicates how many days a property remains on the market before selling. An upward trend suggests a move toward a Buyer’s market, while a downward trend suggests a Seller’s market. The Days on Market for December 2025 was 47, up 17.5% from 40 days last month and up 38.2% from 34 days in December of last year.
The Sold Price versus Original List Price ratio remained steady.
This ratio reflects the average amount sellers agree to reduce from their original list price. A ratio below 100% indicates more of a Buyer’s market, while a ratio at or above 100% indicates more of a Seller’s market. The Sold Price versus Original List Price ratio of 96% was down 1% from last month and down 1% from December of last year.
* Based on 6 month trend – Upward/Downward/Neutral
** Based on 6 month trend – Rising/Falling/Remains Steady
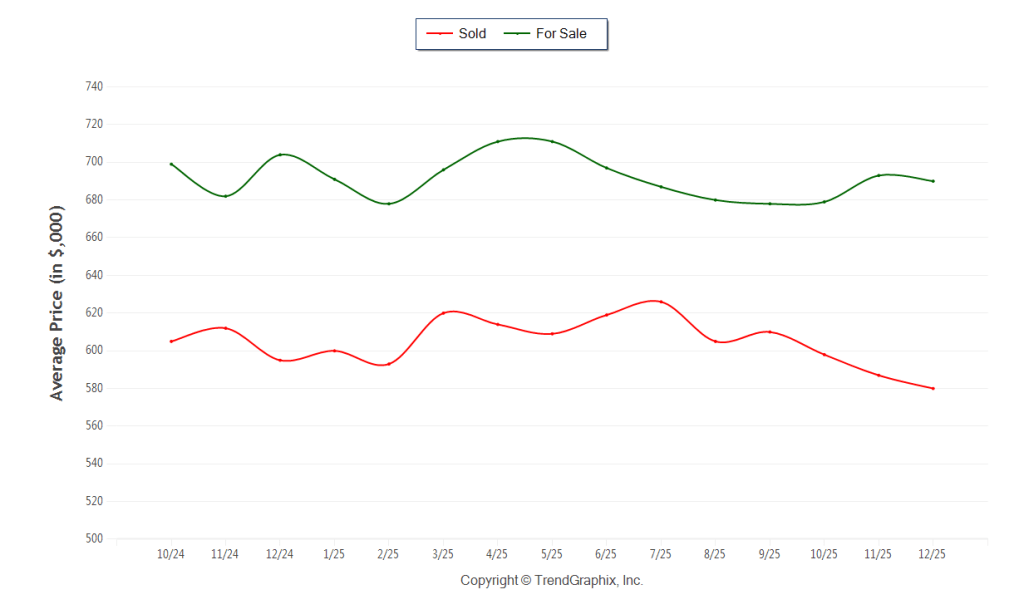
The Average For Sale Price was Neutral.
The Average For Sale Price in December was $690,000, down 2% from $704,000 in December of 2024 and down 0.4% from $693,000 last month.
The Average Sold Price was Depreciating.
The Average Sold Price in December was $580,000, down 2.5% from $595,000 in December of 2024 and down 1.2% from $587,000 last month.
The Median Sold Price was Neutral.
The Median Sold Price in December was $533,000, down 2.9% from $549,000 in December of 2024 and up 0.2% from $532,000 last month.
* Based on 6 month trend – Appreciating/Depreciating/Neutral
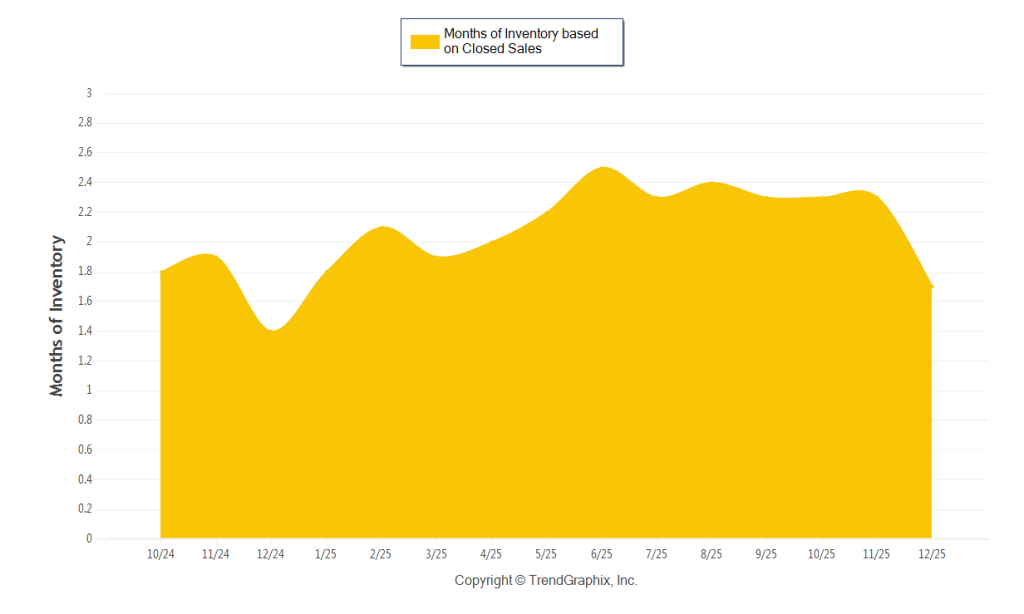
A comparatively lower Months of Inventory is more beneficial for sellers while a higher months of inventory is better for buyers.
*Buyer’s market: more than 6 months of inventory
Seller’s market: less than 3 months of inventory
Neutral market: 3 – 6 months of inventory
Months of Inventory based on Closed Sales:
The December 2025 Months of Inventory based on Closed Sales was 1.7, up 22% compared to last year and down 26.1% compared to last month. December 2025 was a Seller’s market.
Months of Inventory based on Pended Sales:
The December 2025 Months of Inventory based on Pended Sales was 2.0, up 18.1% compared to last year and down 12.9% compared to last month. December 2025 was a Seller’s market.
January 20, 2025 | 8:00am
Sacramento City College Tennis Courts